Luxembourg general election, 2004
| | |||||||||||||||||||||||||||||||||||||||||||||||||||
| |||||||||||||||||||||||||||||||||||||||||||||||||||
| |||||||||||||||||||||||||||||||||||||||||||||||||||
|
| |||||||||||||||||||||||||||||||||||||||||||||||||||
| Results: CSV LSAP DP | |||||||||||||||||||||||||||||||||||||||||||||||||||
| |||||||||||||||||||||||||||||||||||||||||||||||||||


 |
| This article is part of a series on the politics and government of Luxembourg |
| Constitution |
|
Monarchy |
|
| Foreign relations |
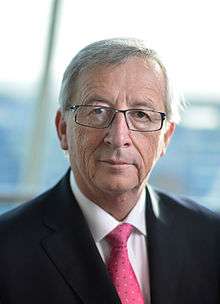
General elections were held in Luxembourg on 13 June 2004,[1] alongside European Parliament elections. The ruling Christian Social People's Party (CSV) of Prime Minister Jean-Claude Juncker won the election, increasing its number of seats to its highest since before 1989 and its share of the vote to levels not seen since the 1959 election.
As expected, the CSV won a plurality of seats, adding 5 new deputies, and continued as the majority partner in the coalition government. However, the junior partner changed from the liberal Democratic Party (DP), which lost 5 seats, to the Luxembourg Socialist Workers' Party (LSAP), which gained one seat. the Greens also slightly increased their representation, whilst the Alternative Democratic Reform Party (ADR) lost ground.
The election coincided with the 2004 European Parliament election.
Candidates
| List # | Party | Running in | Existing seats | ||||
|---|---|---|---|---|---|---|---|
| Centre | Est | Nord | Sud | ||||
| 1 | Alternative Democratic Reform Party (ADR) | |
|
|
|
7 | |
| 2 | Democratic Party (DP) | |
|
|
|
15 | |
| 3 | Luxembourg Socialist Workers' Party (LSAP) | |
|
|
|
13 | |
| 4 | The Greens | |
|
|
|
5 | |
| 5 | Christian Social People's Party (CSV) | |
|
|
|
19 | |
| 6 | The Left | |
|
|
|
1 | |
| 7 | Communist Party (KPL) | |
|
|
|
0 | |
| 8 | Free Party (FPL) | |
|
|
|
0 | |
Results
| Party | Votes | %[a] | Seats | +/– |
|---|---|---|---|---|
| Christian Social People's Party | 1,103,825 | 36.1 | 24 | +5 |
| Luxembourg Socialist Workers' Party | 784,048 | 23.4 | 14 | +1 |
| Democratic Party | 460,601 | 16.1 | 10 | –5 |
| The Greens | 355,895 | 11.6 | 7 | +2 |
| Action Committee for Democracy and Pensions Justice | 278,792 | 10.0 | 5 | –2 |
| The Left | 62,071 | 1.9 | 0 | –1 |
| Communist Party of Luxembourg | 35,524 | 0.9 | 0 | New |
| Free Party | 1,925 | 0.1 | 0 | New |
| Invalid/blank votes | 11,182 | – | – | – |
| Total | 200,092 | 100 | 60 | 0 |
| Registered voters/turnout | 217,683 | 91.9 | – | – |
| Source: Nohlen & Stöver | ||||
a The percentage of votes is not related to the number of votes in the table, as voters could cast more votes in some constituencies than others, and is instead calculated based on the proportion of votes received in each constituency.[2]
By locality

The CSV won pluralities in all four districts; in the previous election, the Democratic Party had won a plurality in Centre. However, the CSV won a better-than-average increase in their vote share in Luxembourg City (of 7.4%) and Centre generally (7.5%), wiping out the DP's advantage and winning 2 deputies in that circonscription alone. The CSV's vote remaining roughly constant across all circonscriptions (in all cases between 35.5% and 38.6%):
| CSV | LSAP | DP | Greens | ADR | The Left | KPL | FPL | |
|---|---|---|---|---|---|---|---|---|
| Centre | 35.5% | 18.8% | 21.3% | 13.6% | 7.9% | 2.0% | 0.9% | 0.0% |
| Est | 38.6% | 16.5% | 19.1% | 12.1% | 12.3% | 1.3% | 0.0% | 0.0% |
| Nord | 36.3% | 15.8% | 20.2% | 10.9% | 14.7% | 1.3% | 0.0% | 0.7% |
| Sud | 35.6% | 32.2% | 9.5% | 10.2% | 8.4% | 2.3% | 1.7% | 0.0% |
The CSV won pluralities across almost all of the country, winning more votes than any other party in 111 of the country's (then) 118 communes. The LSAP won pluralities in five communes in the industrial Red Lands: Differdange, Dudelange, Kayl, Rumelange, Schifflange. The DP won the northern communes of Schieren and Préizerdaul.[3]
References
| General elections | |
|---|---|
| Communal elections | |
| European elections | |
| Referendums | |
* Partial elections. | |