Leimbach, Aargau
| Leimbach | ||
|---|---|---|
_119.JPG) | ||
| ||
 Leimbach | ||
|
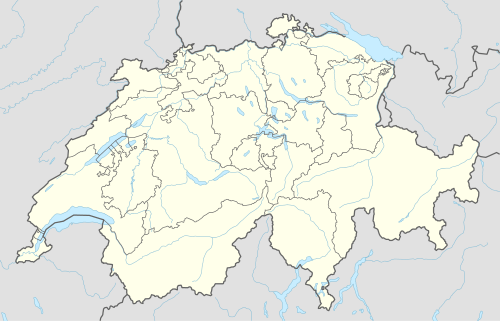
Location of Leimbach  | ||
| Coordinates: 47°16′N 8°10′E / 47.267°N 8.167°ECoordinates: 47°16′N 8°10′E / 47.267°N 8.167°E | ||
| Country | Switzerland | |
| Canton | Aargau | |
| District | Kulm | |
| Area[1] | ||
| • Total | 1.15 km2 (0.44 sq mi) | |
| Elevation | 520 m (1,710 ft) | |
| Population (Dec 2015[2]) | ||
| • Total | 474 | |
| • Density | 410/km2 (1,100/sq mi) | |
| Postal code | 5733 | |
| SFOS number | 4137 | |
| Surrounded by | Gontenschwil, Reinach, Zetzwil | |
| Website |
www SFSO statistics | |

![]() Leimbach is a municipality in the district of Kulm in the canton of Aargau in Switzerland.
Leimbach is a municipality in the district of Kulm in the canton of Aargau in Switzerland.
History
Leimbach is first mentioned in 1300 as Leimbach.[3] During the Middle Ages the rights to collect tithes was divided between the Lords of Reinach, Hallwyl, Heidegg, Rupperswil, Büttikon, Falkenstein, Liebegg, and the Monastery at Beromünster. Starting in 1415 Leimbach was under Berner authority. At the behest of Bern, it broke away in 1528 from the Catholic parish of Pfeffikon and in 1529 joined the Reformed parish of Reinach. It wasn't until 1751 that the village received from Bern its own municipal law and mayor. In 1803, after the Act of Mediation, it became part of the newly formed Canton of Aargau.
In the 18th and 19th Centuries the main sources of income were small scale cotton and tobacco production. Starting in the 1920s, a sheet metal and wire factory was built in the municipality.[3]
Geography
Leimbach has an area, as of 2009, of 1.15 square kilometers (0.44 sq mi). Of this area, 0.58 square kilometers (0.22 sq mi) or 50.4% is used for agricultural purposes, while 0.36 square kilometers (0.14 sq mi) or 31.3% is forested. Of the rest of the land, 0.18 square kilometers (0.069 sq mi) or 15.7% is settled (buildings or roads).[4]
Of the built up area, industrial buildings made up 3.5% of the total area while housing and buildings made up 9.6% and transportation infrastructure made up 2.6%. 31.3% of the total land area is heavily forested. Of the agricultural land, 28.7% is used for growing crops and 16.5% is pastures, while 5.2% is used for orchards or vine crops.[4]
The municipality is located in the Kulm district, in the upper Wynental.
Coat of arms
The blazon of the municipal coat of arms is Gules a Bend Sinister wavy Argent and in chief dexter a Mullet of the same.[5]
Demographics
Leimbach has a population (as of December 2015) of 474[6] As of June 2009, 7.1% of the population are foreign nationals.[7] Over the last 10 years (1997–2007) the population has changed at a rate of 13.1%. Most of the population (as of 2000) speaks German (97.1%), with Italian being second most common ( 1.7%) and Dutch being third ( 0.5%).[8]
The age distribution, as of 2008, in Leimbach is; 46 children or 10.7% of the population are between 0 and 9 years old and 48 teenagers or 11.2% are between 10 and 19. Of the adult population, 41 people or 9.6% of the population are between 20 and 29 years old. 58 people or 13.6% are between 30 and 39, 73 people or 17.1% are between 40 and 49, and 62 people or 14.5% are between 50 and 59. The senior population distribution is 45 people or 10.5% of the population are between 60 and 69 years old, 42 people or 9.8% are between 70 and 79, there are 12 people or 2.8% who are between 80 and 89,and there is 1 person who is between 90 and older.[9]
As of 2000 the average number of residents per living room was 0.53 which is about equal to the cantonal average of 0.57 per room. In this case, a room is defined as space of a housing unit of at least 4 m2 (43 sq ft) as normal bedrooms, dining rooms, living rooms, kitchens and habitable cellars and attics.[10] About 77% of the total households were owner occupied, or in other words did not pay rent (though they may have a mortgage or a rent-to-own agreement).[11]
As of 2000, there were 7 homes with 1 or 2 persons in the household, 48 homes with 3 or 4 persons in the household, and 97 homes with 5 or more persons in the household. The average number of people per household was 2.63 individuals.[12] As of 2000, there were 155 private households (homes and apartments) in the municipality, and an average of 2.6 persons per household.[8] In 2008 there were 117 single family homes (or 66.1% of the total) out of a total of 177 homes and apartments.[13] There were a total of 1 empty apartments for a 0.6% vacancy rate.[13] As of 2007, the construction rate of new housing units was 4.6 new units per 1000 residents.[8]
In the 2007 federal election the most popular party was the SVP which received 47.4% of the vote. The next three most popular parties were the SP (11.9%), the FDP (10.5%) and the CSP (10.1%).[8]
The entire Swiss population is generally well educated. In Leimbach about 78.5% of the population (between age 25-64) have completed either non-mandatory upper secondary education or additional higher education (either university or a Fachhochschule).[8] Of the school age population (in the 2008/2009 school year), there are 52 students attending primary school in the municipality.[12]
The historical population is given in the following table:[3]
| Historical population | ||
|---|---|---|
| Year | Pop. | ±% |
| 1558 | 10 | — |
| 1764 | 91 | +810.0% |
| 1850 | 224 | +146.2% |
| 1900 | 238 | +6.2% |
| 1950 | 249 | +4.6% |
| 2000 | 409 | +64.3% |
Heritage sites of national significance
The Straw-thatched house (German: Strohdachhaus) in Seeberg is listed as a Swiss heritage site of national significance.[14]
Economy
As of 2007, Leimbach had an unemployment rate of 1.29%. As of 2005, there were 25 people employed in the primary economic sector and about 8 businesses involved in this sector. 70 people are employed in the secondary sector and there are 7 businesses in this sector. 40 people are employed in the tertiary sector, with 11 businesses in this sector.[8]
As of 2000 there were 206 residents who worked in the municipality, while 155 residents worked outside Leimbach and 52 people commuted into the municipality for work.[15] Of the working population, 13.1% used public transportation to get to work, and 50% used a private car.[8]
Religion
From the 2000 census, 78 or 19.1% were Roman Catholic, while 272 or 66.5% belonged to the Swiss Reformed Church.[12]
References
- ↑ Arealstatistik Standard - Gemeindedaten nach 4 Hauptbereichen
- ↑ Swiss Federal Statistical Office - STAT-TAB, online database – Ständige und nichtständige Wohnbevölkerung nach institutionellen Gliederungen, Geburtsort und Staatsangehörigkeit (German) accessed 30 August 2016
- 1 2 3 Leimbach in German, French and Italian in the online Historical Dictionary of Switzerland.
- 1 2 Swiss Federal Statistical Office-Land Use Statistics 2009 data (German) accessed 25 March 2010
- ↑ Flags of the World.com accessed 27-April-2010
- ↑ Swiss Federal Statistical Office - STAT-TAB, online database – Ständige und nichtständige Wohnbevölkerung nach institutionellen Gliederungen, Geburtsort und Staatsangehörigkeit (German) accessed 30 August 2016
- ↑ Statistical Department of Canton Aargau -Bereich 01 -Bevölkerung (German) accessed 20 January 2010
- 1 2 3 4 5 6 7 Swiss Federal Statistical Office accessed 27-April-2010
- ↑ Statistical Department of Canton Aargau -Bevölkerungsdaten für den Kanton Aargau und die Gemeinden (Archiv) (German) accessed 20 January 2010
- ↑ Eurostat. "Housing (SA1)". Urban Audit Glossary (pdf). 2007. p. 18. Retrieved 12 February 2010.
- ↑ Urban Audit Glossary pg 17
- 1 2 3 Statistical Department of Canton Aargau - Aargauer Zahlen 2009 (German) accessed 20 January 2010
- 1 2 Statistical Department of Canton Aargau (German) accessed 20 January 2010
- ↑ Swiss inventory of cultural property of national and regional significance 21.11.2008 version, (German) accessed 27-April-2010
- ↑ Statistical Department of Canton Aargau-Bereich 11 Verkehr und Nachrichtenwesen (German) accessed 21 January 2010
| Wikimedia Commons has media related to Leimbach. |