Las Palmas (Spanish Congress electoral district)
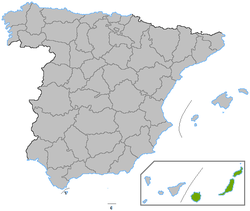
Las Palmas is one of the 52 electoral districts (circunscripciónes) used for the Spanish Congress of Deputies - the lower chamber of the Spanish Parliament, the Cortes Generales. It was first contested in modern times in the 1977 General Election and covers the Eastern part of the Canary Islands. Las Palmas de Gran Canaria is the largest municipality, accounting for over 40% of the electorate [1]
Boundaries and electoral system
Under Article 68 of the Spanish constitution [2] the boundaries must be the same as the province of Las Palmas and under Article 140 this can only be altered with the approval of congress. Voting is on the basis of universal suffrage in a secret ballot. The electoral system used is closed list proportional representation with seats allocated using the D'Hondt method. Only lists which poll 3% or more of all valid votes cast, including votes "en blanco" i.e. for "none of the above" can be considered for seats. Under article 12 of the constitution, the minimum voting age is 18.
.svg.png) |
| This article is part of a series on the politics and government of Spain |
|
Related topics |
Eligibility
Article 67.3 of the Spanish Constitution prohibits dual membership of the Cortes and regional assemblies, meaning that candidates must resign from Regional Assemblies if elected. Article 70 also makes active judges, magistrates, public defenders, serving military personnel, active police officers and members of constitutional and electoral tribunals ineligible.[2]
Number of members
Las Palmas initially returned six members. This was increased to seven members for the 1986 election. It was increased to its current figure of eight members at the 2004 election.
Under Spanish electoral law, all provinces are entitled to a minimum of 2 seats with a remaining 248 seats apportioned according to population.[3] These laws are laid out in detail in the 1985 electoral law. (Ley Orgánica del Régimen Electoral General) The practical effect of this law has been to overrepresent smaller provinces at the expense of larger provinces.
In 2004 Spain had 34,571,831 voters giving an average of 98,777 voters per deputy.[4] Las Palmas was close to the average with the ratio being 92,020.[5]
Summary of seats won 1977–2015
| 1977 | 1979 | 1982 | 1986 | 1989 | 1993 | 1996 | 2000 | 2004 | 2008 | 2011 | 2015 | |
|---|---|---|---|---|---|---|---|---|---|---|---|---|
| Democratic Centre Union (UCD) | 5 | 4 | 1 | |||||||||
| Spanish Socialist Workers' Party (PSOE) | 1 | 1 | 3 | 3 | 3 | 2 | 2 | 1 | 3 | 4 | 2 | 2 |
| Canarian Peoples Union (Unión del Pueblo Canario) (UPC) | 1 | |||||||||||
| People's Party (PP) | 2 | 2 | 2 | 3 | 3 | 4 | 4 | 4 | 5 | 3 | ||
| Democratic and Social Centre (CDS) | 2 | 2 | ||||||||||
| Canarian Coalition (CC) | 2 | 2 | 2 | 1 | 1 | 1 | ||||||
| Podemos (Podemos) | 2 | |||||||||||
| Citizens (C's) | 1 | |||||||||||
Note: Seats shown for the PP include seats won by their predecessors, the Popular Alliance and Popular Coalition before 1989.
The Canarian Peoples Union was a coalition of various local left wing or regionalist parties. After its dissolution in the 1980s some of these parties became part of either the PSOE or the Canarian Coalition.
Results
2015 General Election
Summary of the 20 December 2015 Congress of Deputies election results in Las Palmas
| Parties and alliances | Votes | % | Seats | Members elected |
|---|---|---|---|---|
| People's Party (Partido Popular) | 145,240 | 28.2 | 3 | |
| Podemos | 136,278 | 26.4 | 2 | |
| Spanish Socialist Workers' Party-New Canarias | 115,431 | 22.4 | 2 | |
| Citizens | 63,247 | 12.3 | 1 | |
| Canarian Coalition-Canarian Nationalist Party | 21,755 | 4.2 | 0 | |
| People's Unity | 15,235 | 3.0 | 0 | |
| Animalist Party | 5,348 | 1.0 | 0 | |
| Union, Progress and Democracy | 2,557 | 0.5 | 0 | |
| Others | 6,144 | 1.2 | 0 |
2011 General Election
Summary of the 20 November 2011 Congress of Deputies election results in Las Palmas
| Parties and alliances | Votes | % | Seats | Members elected |
|---|---|---|---|---|
| People's Party (Partido Popular) | 240,897 | 51.0 | 5 | |
| Spanish Socialist Workers' Party (Partido Socialista Obrero Español) | 123,486 | 26.2 | 2 | |
| Canarian Coalition-Canarian Nationalist Party-New Canarias | 53,329 | 11.3 | 1 | |
| United Left | 19,971 | 4.2 | 0 | |
| Union, Progress and Democracy | 13,208 | 2.8 | 0 | |
| Equo | 5,414 | 1.1 | 0 | |
| Others | 6,781 | 1.4 | 0 |
2008 General Election
Summary of the 9 March 2008 Congress of Deputies election results in Las Palmas
| Parties and alliances | Votes | % | Seats | Members elected |
|---|---|---|---|---|
| Spanish Socialist Workers' Party (Partido Socialista Obrero Español) | 215,560 | 42.6 | 4 | |
| People's Party (Partido Popular) | 201,067 | 39.7 | 4 | |
| New Canarias | 38,024 | 7.5 | 0 | |
| Canarian Coalition-Canarian Nationalist Party | 31,103 | 6.1 | 0 | |
| United Left | 5,532 | 1.1 | 0 | |
| Union, Progress and Democracy | 1,827 | 0.4 | 0 | |
| Others | 9,265 | 1.8 | 0 |
2004 General Election
The PSOE had one of their best performances of the entire election here in 2004, gaining two seats and increasing their vote by 15.5%. This was their third biggest percentage increase anywhere. Only Ceuta and Melilla registered bigger increases and the results there were affected by the absence of third party candidates in 2004 who had polled well in 2000.
Summary of the 14 March 2004 Congress of Deputies election results in Las Palmas
| Parties and alliances | Votes | % | Seats | Members elected |
|---|---|---|---|---|
| People's Party (Partido Popular) | 208,995 | 42.21 | 4 | |
| Spanish Socialist Workers' Party (Partido Socialista Obrero Español) | 167,926 | 33.92 | 3 | |
| Canarian Coalition (Coalición Canaria) | 89,420 | 18.06 | 1 | |
| United Left | 9,876 | 1.99 | 0 | |
| Others | 12,871 | 2.60 | 0 |
Source:[6]
2000 General Election
Summary of the 12 March 2000 Congress of Deputies election results in Las Palmas.
| Parties and alliances | Votes | % | Seats | Members elected |
|---|---|---|---|---|
| People's Party (Partido Popular) | 210,774 | 48.05 | 4 | |
| Canarian Coalition (Coalición Canaria) | 113,075 | 25.78 | 2 | |
| Spanish Socialist Workers' Party (Partido Socialista Obrero Español) | 80,695 | 18.40 | 1 | |
| United Left | 10,941 | 2.49 | 0 | |
| Others | 19,202 | 4.40 | 0 |