Kempsey Shire
| Kempsey Shire New South Wales | |||||||||||||
|---|---|---|---|---|---|---|---|---|---|---|---|---|---|
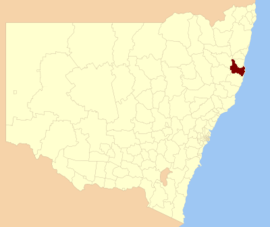 Location in New South Wales | |||||||||||||
| Coordinates | 31°05′S 152°50′E / 31.083°S 152.833°ECoordinates: 31°05′S 152°50′E / 31.083°S 152.833°E | ||||||||||||
| Population | 29,684 (2015 Est.)[1] | ||||||||||||
| • Density | 8.78/km2 (22.7/sq mi) | ||||||||||||
| Established | 1976 | ||||||||||||
| Area | 3,380 km2 (1,305.0 sq mi) | ||||||||||||
| Mayor | Liz Campbell, (Independent) | ||||||||||||
| Council seat | Kempsey | ||||||||||||
| Region | Mid North Coast | ||||||||||||
| State electorate(s) | Oxley | ||||||||||||
| Federal Division(s) | Cowper | ||||||||||||
|
| |||||||||||||
| Website | Kempsey Shire | ||||||||||||
| |||||||||||||
Kempsey Shire is a local government area in the mid north coast region of New South Wales, Australia.
The shire services an area of 3,380 square kilometres (1,310 sq mi) and is located adjacent to the Pacific Highway and the North Coast railway line. Kempsey Shire was formed in 1976 by the amalgamation of the former Kempsey Municipality and the former Macleay Shire.
At the 2011 census, Kempsey Shire has a high proportion of Aboriginal and Torres Strait Islander people residing within its boundaries. The shire also contains a coastal strip that was initially identified in 2007, and confirmed in 2015, as one of the most socially disadvantaged areas in Australia.[2][3][4]
The Mayor of the Kempsey Shire is Liz Campbell, an independent politician.
Towns and localities
Towns and localities in the Kempsey Shire are:
- Kempsey
- East Kempsey
- South Kempsey
- West Kempsey
- Aldavilla
- Arakoon
- Bellbrook
- Bellimbopinni
- Belmore River
- Burnt Bridge
- Carcolla
- Clybucca
- Collombatti
- Comara
- Crescent Head
- Dondingalong
- Euroka
- Frederickton
- Gladstone
- Greenhill
- Hat Head
- Jerseyville
- Kinchela
- Kundabung
- Millbank
- Mungay Creek
- New Entrance
- Nulla Nulla
- Oceanside
- Rainbow Beach
- Sherwood
- Smithtown
- South West Rocks
- Stuarts Point
- Turners Flat
- Warbro
- Willawarrin
- Yarrahapinni
- Yarravel
Demographics
At the 2011 census, there were 28,134 people in the Kempsey Shire local government area, of these 50.2 per cent were male and 49.8 per cent were female. Aboriginal and Torres Strait Islander people made up 11.1 per cent of the population, more than four times the national average. The median age of people in the Kempsey Shire was 45 years; some eight years older than the national median. Children aged 0 – 14 years made up 19.4 per cent of the population and people aged 65 years and over made up 19.8 per cent of the population. Of people in the area aged 15 years and over, 45.4 per cent were married and 15.4 per cent were either divorced or separated.[5]
Population growth in the Kempsey Shire between the 2001 census and the 2006 census was 1.86 per cent; and in the subsequent five years to the 2011 census was 2.73 per cent. When compared with total population growth of Australia for the same periods, being 5.78 per cent and 8.32 per cent respectively, population growth in the Kempsey Shire local government area was significantly lower than the national average.[6] The median weekly income for residents within the Kempsey Shire was significantly below the national average,[5][7] being one of the factors that place parts of the Kempsey Shire in an area of social disadvantage.[8]
At the 2011 Census, the proportion of residents in the Kempsey Shire local government area who stated their ancestry as Australian or Anglo-Saxon exceeded 81 per cent of all residents (national average was 65.2 per cent). In excess of 62 per cent of all residents in the Kempsey Shire nominated a religious affiliation with Christianity at the 2011 census, which was higher than the national average of 50.2 per cent. Meanwhile, as at the Census date, compared to the national average, households in the Kempsey Shire local government area had a significantly lower than average proportion (3.3 per cent) where two or more languages are spoken (national average was 20.4 per cent); and a significantly higher proportion (91.9 per cent) where English only was spoken at home (national average was 76.8 per cent).[5]
| Selected historical census data for Kempsey local government area | |||||
|---|---|---|---|---|---|
| Census year | 2001[6] | 2006[7] | 2011[5] | ||
| Population | Estimated residents on Census night | 26,887 | 27,387 | 28,134 | |
| LGA rank in terms of size within New South Wales | 62nd | ||||
| % of New South Wales population | 0.41% | ||||
| % of Australian population | 0.14% | ||||
| Cultural and language diversity | |||||
| Ancestry, top responses | Australian | 35.3% | |||
| English | 31.7% | ||||
| Irish | 8.3% | ||||
| Scottish | 6.0% | ||||
| German | 2.6% | ||||
| Language, top responses (other than English) | German | 0.2% | |||
| Tagalog | 0.1% | ||||
| Cantonese | n/c | n/c | |||
| Dutch | 0.1% | ||||
| French | 0.1% | ||||
| Religious affiliation | |||||
| Religious affiliation, top responses | Anglican | 29.9% | |||
| Catholic | 25.9% | ||||
| No Religion | 11.9% | ||||
| Uniting Church | 9.8% | ||||
| Presbyterian and Reformed | 3.9% | ||||
| Median weekly incomes | |||||
| Personal income | Median weekly personal income | A$319 | A$386 | ||
| % of Australian median income | 68.5% | ||||
| Family income | Median weekly family income | A$614 | A$902 | ||
| % of Australian median income | 59.8% | ||||
| Household income | Median weekly household income | A$737 | A$748 | ||
| % of Australian median income | 62.9% | ||||
Council
Current composition and election method
Kempsey Shire Council is composed of nine Councillors, including the Mayor, for a fixed four-year term of office. The Mayor is directly elected while the eight other Councillors are elected proportionally as one entire ward. The most recent election was held on 10 September 2016, and the makeup of the Council is as follows:[9]
| Party | Councillors | |
|---|---|---|
| Independents and Unaligned | 9 | |
| Total | 9 | |
The current Council, elected in 2016, in order of election, is:[9]
| Councillor | Party | Notes | |
|---|---|---|---|
| Elizabeth Campbell | Unaligned | Mayor | |
| Anna Shields | Unaligned | ||
| Dean Saul | Independent | ||
| Anthony Patterson | Unaligned | ||
| Mark Baxter | Independent | ||
| Susan McGinn | Independent | ||
| Leo Hauville | Independent | ||
| Bruce Morris | Independent | ||
| Ashley Williams | Independent | ||
References
- ↑ "3218.0 – Regional Population Growth, Australia, 2014–15". Australian Bureau of Statistics. Retrieved 29 September 2016.
- ↑ Vinson, Tony (February 2007). "Dropping off the edge". Jesuit Social Services and Catholic Social Services. Retrieved 10 April 2007.
- ↑ Horin, Adele (26 February 2007). "Stuck in a down town". The Sydney Morning Herald. Retrieved 1 December 2012.
- ↑ Vinson, Tony (August 2015). "New South Wales fact sheet" (PDF). Dropping off the Edge. Jesuit Social Services and Catholic Social Services Australia. Retrieved 28 May 2016.
- 1 2 3 4 Australian Bureau of Statistics (31 October 2012). "Kempsey (A)". 2011 Census QuickStats. Retrieved 1 December 2012.
- 1 2 Australian Bureau of Statistics (9 March 2006). "Kempsey (A)". 2001 Census QuickStats. Retrieved 1 December 2012.
- 1 2 Australian Bureau of Statistics (25 October 2007). "Kempsey (A)". 2006 Census QuickStats. Retrieved 1 December 2012.
- ↑ Horin, Adele (26 February 2007). "Economic boom bypasses nation's poor". The Sydney Morning Herald. Retrieved 1 December 2012.
- 1 2 "Election 2016: Councillor Election Results" (PDF). Kempsey Shire Council. Australian Election Company. 16 September 2016. Retrieved 6 November 2016.