Jaffna Electoral District
| Jaffna | |
|---|---|
|
Electoral District for the Parliament of Sri Lanka | |
| Administrative District | |
| Province | Northern |
| Polling divisions | 11 |
| Population | 696,253 (2011)[1] |
| Electorate | 529,239 (2014)[2] |
| Current Electoral District | |
| Created | 1978 |
| Seats |
|
| MPs | |
| Provincial Council | Northern |
| Created from | |
Jaffna Electoral District is one of the 22 multi-member electoral districts of Sri Lanka created by the 1978 Constitution of Sri Lanka. The district covers the administrative districts of Jaffna and Kilinochchi in the Northern province. The district currently elects 9 of the 225 members of the Sri Lankan Parliament and had 529,239 registered electors in 2014.[2]
Election results
Presidential elections
1982 presidential election
Results of the 1st presidential election held on 20 October 1982:[3]
| Candidate | Party | Votes per Polling Division | Postal Votes | Total Votes | % | |||||||||||
|---|---|---|---|---|---|---|---|---|---|---|---|---|---|---|---|---|
| Chavaka -chcheri | Jaffna | Kankesan -thurai | Kayts | Kilino -chchi | Kopay | Manipay | Nallur | Point Pedro | Udu- piddy | Vaddu -koddai | ||||||
| Kumar Ponnambalam | ACTC | 9,742 | 9,319 | 6,065 | 8,353 | 9,822 | 4,984 | 7,514 | 8,979 | 5,367 | 5,779 | 9,741 | 1,598 | 87,263 | 40.03% | |
| Hector Kobbekaduwa | SLFP | 6,128 | 3,258 | 9,523 | 3,393 | 4,188 | 13,678 | 9,008 | 4,330 | 6,348 | 8,155 | 7,770 | 1,431 | 77,300 | 35.46% | |
| J. R. Jayewardene | UNP | 3,629 | 6,419 | 3,771 | 4,067 | 3,616 | 3,546 | 4,463 | 4,831 | 3,198 | 2,282 | 3,700 | 1,253 | 44,780 | 20.54% | |
| Colvin R. de Silva | LSSP | 419 | 134 | 310 | 157 | 171 | 423 | 483 | 332 | 217 | 353 | 257 | 120 | 3,376 | 1.55% | |
| Rohana Wijeweera | JVP | 204 | 176 | 341 | 119 | 188 | 379 | 559 | 244 | 189 | 208 | 380 | 111 | 3,098 | 1.42% | |
| Vasudeva Nanayakkara | NSSP | 125 | 186 | 184 | 98 | 102 | 182 | 298 | 243 | 150 | 224 | 255 | 129 | 2,186 | 1.00% | |
| Valid Votes | 20,247 | 19,502 | 20,194 | 16,187 | 18,087 | 23,282 | 22,330 | 18,959 | 15,469 | 17,001 | 22,103 | 4,642 | 218,003 | 100.00% | ||
| Rejected Votes | 1,205 | 711 | 1.078 | 943 | 1,012 | 1,023 | 1,069 | 894 | 585 | 816 | 1,076 | 198 | 10,610 | |||
| Total Polled | 21,452 | 20,213 | 21,272 | 17,130 | 19,099 | 24,305 | 23,399 | 19,853 | 16,054 | 17,817 | 23,179 | 4,840 | 228,613 | |||
| Registered Electors | 44,597 | 42,296 | 51,681 | 42,563 | 39,773 | 49,577 | 48,930 | 49,233 | 34,859 | 43,990 | 46,206 | 493,705 | ||||
| Turnout (%) | 48.10% | 47.79% | 41.16% | 40.25% | 48.02% | 49.02% | 47.82% | 40.32% | 46.05% | 40.50% | 50.16% | 46.31% | ||||
1988 presidential election
Results of the 2nd presidential election held on 19 December 1988:[4]
| Candidate | Party | Votes per Polling Division | Total Votes | % | |||||||||||
|---|---|---|---|---|---|---|---|---|---|---|---|---|---|---|---|
| Chavaka -chcheri | Jaffna | Kankesan -thurai | Kayts | Kilino -chchi | Kopay | Manipay | Nallur | Point Pedro | Udu- piddy | Vaddu -koddai | |||||
| Sirimavo Bandaranaike | SLFP | 3,704 | 3,546 | 3,117 | 3,264 | 4,064 | 5,833 | 3,491 | 3,362 | 3,921 | 3,400 | 6,495 | 44,197 | 36.82% | |
| Ossie Abeygunasekera | SLPP | 4,023 | 3,616 | 3,840 | 4,503 | 2,596 | 4,325 | 5,089 | 2,924 | 2,910 | 3,120 | 5,252 | 42,198 | 35.15% | |
| Ranasinghe Premadasa | UNP | 2,300 | 3,475 | 2,364 | 4,628 | 3,793 | 2,493 | 4,006 | 2,000 | 2,620 | 1,662 | 4,309 | 33,650 | 28.03% | |
| Valid Votes | 10,027 | 10,637 | 9,321 | 12,395 | 10,453 | 12,651 | 12,586 | 8,286 | 9,451 | 8,182 | 16,056 | 120,045 | 100.00% | ||
| Rejected Votes | 1,035 | 479 | 451 | 596 | 378 | 733 | 891 | 482 | 772 | 303 | 2,397 | 8,517 | |||
| Total Polled | 11,062 | 11,116 | 9,772 | 12,991 | 10,831 | 13,384 | 13,477 | 8,768 | 10,223 | 8,485 | 18,453 | 128,562 | |||
| Registered Electors | 51,595 | 49,229 | 60,386 | 49,481 | 53,604 | 56,450 | 58,320 | 61,936 | 40,175 | 52,084 | 58,522 | 591,782 | |||
| Turnout (%) | 21.44% | 22.58% | 16.18% | 26.25% | 20.21% | 23.71% | 23.11% | 14.16% | 25.45% | 16.29% | 31.53% | 21.72% | |||
1994 presidential election
Results of the 3rd presidential election held on 9 November 1994:[5]
| Candidate | Party | Votes per Polling Division | Postal Votes | Total Votes | % | |||||||||||
|---|---|---|---|---|---|---|---|---|---|---|---|---|---|---|---|---|
| Chavaka -chcheri | Jaffna | Kankesan -thurai | Kayts | Kilino -chchi | Kopay | Manipay | Nallur | Point Pedro | Udu- piddy | Vaddu -koddai | ||||||
| Chandrika Kumaratunga | PA | 63 | 1,143 | 116 | 14,761 | 174 | 11 | 18 | 21 | 8 | 24 | 539 | 56 | 16,934 | 96.35% | |
| Hudson Samarasinghe | Ind 2 | 1 | 15 | 3 | 291 | 0 | 0 | 0 | 0 | 0 | 00 | 31 | 0 | 341 | 1.94% | |
| Srimathi Dissanayake | UNP | 6 | 108 | 6 | 83 | 9 | 1 | 0 | 2 | 0 | 2 | 6 | 0 | 223 | 1.27% | |
| Harischandra Wijayatunga | SMBP | 0 | 1 | 1 | 27 | 1 | 0 | 0 | 0 | 0 | 0 | 6 | 0 | 36 | 0.20% | |
| G. A. Nihal | SLPF | 0 | 4 | 0 | 17 | 2 | 0 | 0 | 0 | 0 | 0 | 2 | 0 | 25 | 0.14% | |
| A. J. Ranashinge | Ind 1 | 0 | 1 | 1 | 14 | 0 | 0 | 0 | 0 | 0 | 0 | 0 | 0 | 16 | 0.09% | |
| Valid Votes | 70 | 1,272 | 127 | 15,193 | 186 | 12 | 18 | 23 | 8 | 26 | 584 | 56 | 17,575 | 100.00% | ||
| Rejected Votes | 3 | 7 | 0 | 120 | 7 | 0 | 0 | 0 | 0 | 0 | 4 | 0 | 141 | |||
| Total Polled | 73 | 1,279 | 127 | 15,313 | 193 | 12 | 18 | 23 | 8 | 26 | 588 | 56 | 17,716 | |||
| Registered Electors | 51,717 | 50,045 | 60,417 | 49,504 | 55,995 | 56,496 | 58,382 | 62,372 | 40,336 | 52,153 | 58,949 | 62 | 596,366 | |||
| Turnout (%) | 0.14% | 2.56% | 0.21% | 30.93% | 0.34% | 0.02% | 0.03% | 0.04% | 0.02% | 0.05% | 1.00% | 90.32% | 2.97% | |||
1999 presidential election
Results of the 4th presidential election held on 21 December 1999:[6]
| Candidate | Party | Votes per Polling Division | Postal Votes | Total Votes | % | |||||||||||
|---|---|---|---|---|---|---|---|---|---|---|---|---|---|---|---|---|
| Chavaka -chcheri | Jaffna | Kankesan -thurai | Kayts | Kilino -chchi | Kopay | Manipay | Nallur | Point Pedro | Udu- piddy | Vaddu -koddai | ||||||
| Chandrika Kumaratunga | PA | 3,430 | 3,471 | 5,324 | 3,377 | 593 | 6,607 | 9,194 | 5,125 | 3,062 | 4,664 | 6,854 | 342 | 52,043 | 46.65% | |
| Ranil Wickremasinghe | UNP | 7,494 | 3,263 | 2,271 | 3,580 | 1,262 | 5,941 | 5,003 | 4,834 | 4,270 | 5,685 | 4,232 | 170 | 48,005 | 43.03% | |
| Vasudeva Nanayakkara | LDA | 356 | 151 | 208 | 154 | 33 | 332 | 386 | 328 | 258 | 417 | 466 | 305 | 3,394 | 3.04% | |
| W. V. M. Ranjith | Ind 2 | 127 | 57 | 197 | 108 | 26 | 335 | 311 | 113 | 95 | 210 | 293 | 1 | 1,873 | 1.68% | |
| Rajiva Wijesinha | Liberal | 109 | 28 | 158 | 62 | 22 | 265 | 191 | 95 | 72 | 138 | 228 | 0 | 1,368 | 1.23% | |
| Abdul Rasool | SLMP | 158 | 46 | 90 | 84 | 31 | 161 | 126 | 47 | 80 | 88 | 125 | 5 | 1,041 | 0.93% | |
| T. Edirisuriya | Ind 1 | 84 | 25 | 81 | 45 | 11 | 122 | 104 | 49 | 65 | 118 | 127 | 0 | 831 | 0.74% | |
| Harischandra Wijayatunga | SMBP | 77 | 22 | 93 | 40 | 12 | 133 | 115 | 54 | 58 | 72 | 139 | 3 | 818 | 0.73% | |
| Hudson Samarasinghe | Ind 3 | 51 | 10 | 49 | 31 | 6 | 111 | 55 | 41 | 32 | 88 | 77 | 1 | 552 | 0.49% | |
| Kamal Karunadasa | PLSF | 33 | 14 | 58 | 34 | 3 | 84 | 73 | 29 | 34 | 53 | 71 | 1 | 487 | 0.44% | |
| Nandana Gunathilake | JVP | 68 | 11 | 24 | 50 | 6 | 49 | 57 | 18 | 33 | 44 | 53 | 0 | 413 | 0.37% | |
| A. W. Premawardhana | PFF | 62 | 7 | 25 | 32 | 3 | 78 | 40 | 24 | 31 | 51 | 49 | 1 | 403 | 0.36% | |
| A. Dissanayaka | DUNF | 49 | 8 | 28 | 20 | 8 | 55 | 36 | 21 | 28 | 41 | 49 | 0 | 340 | 0.30% | |
| Valid Votes | 12,098 | 7,113 | 8,606 | 7,617 | 2,016 | 14,273 | 15,691 | 10,778 | 8,118 | 11,669 | 12,760 | 829 | 111,568 | 100.00% | ||
| Rejected Votes | 1,059 | 314 | 321 | 419 | 117 | 577 | 714 | 384 | 453 | 737 | 767 | 119 | 5,981 | |||
| Total Polled | 13,157 | 7,427 | 8,927 | 8,036 | 2,133 | 14,850 | 16,405 | 11,162 | 8,571 | 12,406 | 13,527 | 948 | 117,549 | |||
| Registered Electors | 53,247 | 51,581 | 61,514 | 50,885 | 56,792 | 58,751 | 62,002 | 63,799 | 42,304 | 53,545 | 58,350 | 612,770 | ||||
| Turnout (%) | 24.71% | 14.40% | 14.51% | 15.79% | 3.76% | 25.28% | 26.46% | 17.50% | 20.26% | 23.17% | 23.18% | 19.18% | ||||
2005 presidential election
Results of the 5th presidential election held on 17 November 2005:[7]
| Candidate | Party | Votes per Polling Division | Postal Votes | Displaced Votes | Total Votes | % | |||||||||||
|---|---|---|---|---|---|---|---|---|---|---|---|---|---|---|---|---|---|
| Chavaka -chcheri | Jaffna | Kankesan -thurai | Kayts | Kilino -chchi | Kopay | Manipay | Nallur | Point Pedro | Udu- piddy | Vaddu -koddai | |||||||
| Ranil Wickremasinghe | UNP | 33 | 301 | 148 | 98 | 1 | 267 | 256 | 198 | 25 | 52 | 191 | 1,405 | 2,548 | 5,523 | 70.20% | |
| Mahinda Rajapaksa | UPFA | 10 | 124 | 97 | 139 | 0 | 54 | 64 | 100 | 9 | 11 | 53 | 327 | 979 | 1,967 | 25.00% | |
| Victor Hettigoda | ULPP | 0 | 3 | 0 | 3 | 0 | 1 | 0 | 2 | 0 | 1 | 0 | 109 | 1 | 120 | 1.53% | |
| Siritunga Jayasuriya | USP | 2 | 4 | 2 | 3 | 0 | 14 | 11 | 2 | 0 | 0 | 3 | 5 | 26 | 72 | 0.92% | |
| A. A. Suraweera | NDF | 0 | 2 | 3 | 3 | 0 | 5 | 1 | 1 | 0 | 0 | 3 | 4 | 12 | 34 | 0.43% | |
| A. K. J. Arachchige | DUA | 1 | 1 | 3 | 4 | 0 | 2 | 3 | 4 | 0 | 0 | 0 | 3 | 10 | 31 | 0.39% | |
| Wije Dias | SEP | 1 | 1 | 0 | 10 | 0 | 1 | 0 | 0 | 0 | 0 | 2 | 10 | 4 | 29 | 0.37% | |
| Chamil Jayaneththi | NLF | 2 | 1 | 2 | 2 | 0 | 5 | 1 | 0 | 1 | 0 | 2 | 7 | 1 | 24 | 0.31% | |
| Anura De Silva | ULF | 0 | 0 | 2 | 1 | 0 | 4 | 3 | 1 | 0 | 0 | 1 | 3 | 6 | 21 | 0.27% | |
| P. Nelson Perera | SLPF | 0 | 1 | 1 | 0 | 0 | 2 | 1 | 0 | 0 | 0 | 3 | 4 | 4 | 16 | 0.20% | |
| Wimal Geeganage | SLNF | 1 | 0 | 0 | 0 | 0 | 4 | 0 | 0 | 0 | 0 | 2 | 4 | 4 | 15 | 0.19% | |
| Aruna de Soyza | RPP | 0 | 0 | 2 | 0 | 0 | 3 | 0 | 0 | 0 | 0 | 3 | 2 | 2 | 12 | 0.15% | |
| H. S. Dharmadwaja | UNAF | 0 | 0 | 0 | 0 | 0 | 0 | 0 | 0 | 0 | 0 | 0 | 2 | 2 | 4 | 0.05% | |
| Valid Votes | 50 | 438 | 260 | 263 | 1 | 362 | 340 | 308 | 35 | 64 | 263 | 1,885 | 3,599 | 7,868 | 100.00% | ||
| Rejected Votes | 3 | 17 | 7 | 13 | 0 | 26 | 17 | 5 | 4 | 1 | 15 | 441 | 107 | 656 | |||
| Total Polled | 53 | 455 | 267 | 276 | 1 | 388 | 357 | 313 | 39 | 65 | 278 | 2,326 | 3,706 | 8,524 | |||
| Registered Electors | 62,022 | 62,089 | 67,133 | 52,986 | 89,454 | 63,752 | 68,783 | 70,251 | 47,188 | 55,499 | 62,781 | 701,938 | |||||
| Turnout (%) | 0.08% | 0.73% | 0.40% | 0.52% | 0.00% | 0.61% | 0.52% | 0.45% | 0.08% | 0.12% | 0.44% | 1.21% | |||||
2010 presidential election
Results of the 6th presidential election held on 26 January 2010:[8]
| Candidate | Party | Votes per Polling Division | Postal Votes | Displaced Votes | Total Votes | % | |||||||||||
|---|---|---|---|---|---|---|---|---|---|---|---|---|---|---|---|---|---|
| Chavaka -chcheri | Jaffna | Kankesan -thurai | Kayts | Kilino -chchi | Kopay | Manipay | Nallur | Point Pedro | Udu- piddy | Vaddu -koddai | |||||||
| Sarath Fonseka | NDF | 11,599 | 7,914 | 8,216 | 3,976 | 4,717 | 13,151 | 13,390 | 11,543 | 8,585 | 8,974 | 11,712 | 3,173 | 6,927 | 113,877 | 63.84% | |
| Mahinda Rajapaksa | UPFA | 4,567 | 3,296 | 4,559 | 4,611 | 991 | 4,538 | 5,749 | 3,554 | 2,361 | 2,545 | 4,247 | 892 | 2,244 | 44,154 | 24.75% | |
| M. C. M. Ismail | DUNF | 323 | 107 | 254 | 283 | 199 | 528 | 391 | 196 | 223 | 301 | 326 | 6 | 233 | 3,370 | 1.89% | |
| C. J. Sugathsiri Gamage | UDF | 493 | 139 | 283 | 144 | 45 | 471 | 447 | 231 | 227 | 314 | 486 | 4 | 41 | 3,325 | 1.86% | |
| M. K. Shivajilingam | Ind 5 | 348 | 126 | 207 | 284 | 42 | 306 | 231 | 173 | 326 | 334 | 500 | 263 | 65 | 3,205 | 1.80% | |
| A. A. Suraweera | NDF | 141 | 50 | 169 | 136 | 28 | 160 | 189 | 73 | 73 | 97 | 164 | 2 | 28 | 1,310 | 0.73% | |
| Vikramabahu Karunaratne | LF | 121 | 41 | 88 | 56 | 23 | 151 | 173 | 89 | 100 | 78 | 139 | 49 | 20 | 1,128 | 0.63% | |
| Siritunga Jayasuriya | USP | 113 | 18 | 68 | 42 | 19 | 146 | 122 | 68 | 47 | 68 | 110 | 1 | 18 | 840 | 0.47% | |
| Sarath Manamendra | NSH | 94 | 29 | 59 | 32 | 26 | 112 | 106 | 50 | 44 | 68 | 71 | 6 | 35 | 732 | 0.41% | |
| Lal Perera | ONF | 55 | 30 | 56 | 30 | 32 | 98 | 101 | 52 | 43 | 61 | 106 | 0 | 32 | 696 | 0.39% | |
| Ukkubanda Wijekoon | Ind 3 | 82 | 31 | 70 | 38 | 10 | 93 | 105 | 52 | 34 | 71 | 85 | 1 | 11 | 683 | 0.38% | |
| Wije Dias | SEP | 92 | 20 | 32 | 94 | 19 | 68 | 62 | 25 | 43 | 58 | 127 | 1 | 16 | 657 | 0.37% | |
| A. S. P. Liyanage | SLLP | 80 | 31 | 59 | 43 | 23 | 100 | 85 | 54 | 24 | 50 | 75 | 0 | 21 | 645 | 0.36% | |
| W. V. Mahiman Ranjith | Ind 1 | 59 | 27 | 51 | 60 | 27 | 83 | 66 | 31 | 39 | 47 | 63 | 2 | 16 | 571 | 0.32% | |
| Sarath Kongahage | UNAF | 67 | 23 | 35 | 33 | 12 | 64 | 63 | 37 | 41 | 57 | 71 | 3 | 12 | 518 | 0.29% | |
| Aithurus M. Illias | Ind 2 | 85 | 19 | 43 | 36 | 8 | 72 | 48 | 31 | 27 | 41 | 62 | 1 | 12 | 485 | 0.27% | |
| M. Mohamed Musthaffa | Ind 4 | 71 | 10 | 49 | 15 | 10 | 84 | 56 | 27 | 35 | 43 | 75 | 0 | 10 | 485 | 0.27% | |
| Sanath Pinnaduwa | NA | 47 | 8 | 35 | 18 | 13 | 67 | 45 | 36 | 24 | 38 | 63 | 0 | 18 | 412 | 0.23% | |
| Senaratna de Silva | PNF | 45 | 11 | 37 | 15 | 8 | 65 | 51 | 13 | 20 | 31 | 51 | 1 | 10 | 358 | 0.20% | |
| Aruna de Soyza | RPP | 41 | 12 | 19 | 12 | 8 | 64 | 35 | 16 | 30 | 38 | 70 | 2 | 4 | 351 | 0.20% | |
| Battaramulla Seelarathana | JP | 36 | 7 | 28 | 16 | 11 | 53 | 41 | 20 | 20 | 21 | 46 | 2 | 6 | 307 | 0.17% | |
| M. B. Thaminimulla | ACAKO | 31 | 11 | 23 | 9 | 9 | 34 | 38 | 20 | 22 | 20 | 35 | 1 | 7 | 260 | 0.15% | |
| Valid Votes | 18,590 | 11,960 | 14,440 | 9,983 | 6,280 | 20,508 | 21,594 | 16,391 | 12,388 | 13,355 | 18,684 | 4,410 | 9,786 | 178,369 | 100.00% | ||
| Rejected Votes | 860 | 454 | 493 | 338 | 286 | 625 | 881 | 557 | 440 | 600 | 752 | 116 | 361 | 6,763 | |||
| Total Polled | 19,450 | 12,414 | 14,933 | 10,321 | 6,566 | 21,133 | 22,475 | 16,948 | 12,828 | 13,955 | 19,436 | 4,526 | 10,147 | 185,132 | |||
| Registered Electors | 65,141 | 64,714 | 69,082 | 53,111 | 90,811 | 65,798 | 71,114 | 72,558 | 48,613 | 56,426 | 63,991 | 721,359 | |||||
| Turnout | 29.86% | 19.18% | 21.62% | 19.43% | 7.23% | 32.12% | 31.60% | 23.36% | 26.39% | 24.73% | 30.37% | 25.66% | |||||
2015 presidential election
Results of the 7th presidential election held on 8 January 2015:[2]
| Candidate | Party | Votes per Polling Division | Postal Votes | Total Votes | % | |||||||||||
|---|---|---|---|---|---|---|---|---|---|---|---|---|---|---|---|---|
| Chavaka -chcheri | Jaffna | Kankesan -thurai | Kayts | Kilino -chchi | Kopay | Manipay | Nallur | Point Pedro | Udu- piddy | Vaddu -koddai | ||||||
| Maithripala Sirisena | NDF | 23,520 | 17,994 | 18,729 | 8,144 | 38,856 | 27,161 | 26,958 | 24,929 | 17,388 | 18,137 | 20,873 | 10,885 | 253,574 | 74.42% | |
| Mahinda Rajapaksa | UPFA | 5,599 | 4,502 | 5,705 | 5,959 | 13,300 | 6,211 | 7,225 | 5,405 | 4,213 | 3,937 | 7,791 | 4,607 | 74,454 | 21.85% | |
| Maulawi Ibrahim Mohanmed Mishlar | UPF | 215 | 71 | 169 | 67 | 215 | 213 | 155 | 112 | 96 | 125 | 163 | 19 | 1,620 | 0.48% | |
| A. S. P. Liyanage | SLLP | 142 | 81 | 125 | 70 | 161 | 193 | 178 | 110 | 87 | 108 | 133 | 10 | 1,398 | 0.41% | |
| Namal Ajith Rajapaksa | ONF | 123 | 41 | 102 | 55 | 184 | 180 | 123 | 52 | 65 | 93 | 108 | 24 | 1,150 | 0.34% | |
| Aithurus M. Illias | Ind | 97 | 41 | 94 | 38 | 123 | 114 | 137 | 74 | 49 | 82 | 107 | 22 | 978 | 0.29% | |
| Ratnayake Arachchige Sirisena | PNF | 127 | 52 | 87 | 51 | 180 | 105 | 96 | 55 | 59 | 79 | 78 | 9 | 978 | 0.29% | |
| Siritunga Jayasuriya | USP | 96 | 66 | 105 | 34 | 115 | 118 | 128 | 79 | 47 | 50 | 122 | 15 | 975 | 0.29% | |
| Ruwanthileke Peduru | ULPP | 81 | 40 | 77 | 33 | 149 | 156 | 103 | 67 | 59 | 65 | 102 | 10 | 942 | 0.28% | |
| Sarath Manamendra | NSH | 76 | 33 | 61 | 30 | 106 | 88 | 71 | 34 | 44 | 59 | 67 | 8 | 677 | 0.20% | |
| Sundaram Mahendran | NSSP | 56 | 27 | 38 | 22 | 77 | 73 | 69 | 50 | 41 | 47 | 50 | 73 | 623 | 0.18% | |
| Pani Wijesiriwardene | SEP | 51 | 24 | 40 | 63 | 92 | 77 | 60 | 35 | 18 | 53 | 90 | 12 | 615 | 0.18% | |
| Duminda Nagamuwa | FSP | 69 | 31 | 51 | 26 | 66 | 89 | 69 | 40 | 38 | 43 | 78 | 10 | 610 | 0.18% | |
| Muthu Bandara Theminimulla | AACAAK | 62 | 33 | 58 | 11 | 56 | 93 | 69 | 44 | 28 | 45 | 66 | 3 | 568 | 0.17% | |
| Anurudha Polgampola | Ind | 51 | 14 | 59 | 18 | 63 | 56 | 63 | 44 | 36 | 44 | 55 | 5 | 508 | 0.15% | |
| Prasanna Priyankara | DNM | 29 | 15 | 40 | 16 | 39 | 51 | 44 | 34 | 22 | 30 | 30 | 10 | 360 | 0.11% | |
| Battaramulle Seelarathana | JSP | 29 | 11 | 42 | 19 | 41 | 41 | 43 | 22 | 11 | 24 | 39 | 7 | 329 | 0.10% | |
| Jayantha Kulathunga | ULGC | 19 | 12 | 19 | 14 | 37 | 22 | 20 | 15 | 12 | 17 | 23 | 4 | 214 | 0.06% | |
| Wimal Geeganage | SLNF | 14 | 8 | 15 | 8 | 26 | 33 | 16 | 11 | 7 | 14 | 22 | 4 | 178 | 0.05% | |
| Valid Votes | 30,456 | 23,096 | 25,616 | 14,678 | 53,886 | 35,074 | 35,627 | 31,212 | 22,320 | 23,052 | 29,997 | 15,737 | 340,751 | 100.00% | ||
| Rejected Votes | 953 | 423 | 822 | 495 | 1,940 | 1,138 | 960 | 660 | 576 | 574 | 1,043 | 454 | 10,038 | |||
| Total Polled | 31,409 | 23,519 | 26,438 | 15,173 | 55,826 | 36,212 | 36,587 | 31,872 | 22,896 | 23,626 | 31,040 | 16,191 | 350,789 | |||
| Registered Electors | 51,702 | 33,050 | 63,217 | 22,057 | 79,093 | 55,891 | 54,567 | 46,699 | 36,138 | 39,204 | 47,621 | 529,239 | ||||
| Turnout | 60.75% | 71.16% | 41.82% | 68.79% | 70.58% | 64.79% | 67.05% | 68.25% | 63.36% | 60.26% | 65.18% | 66.28% | ||||
Parliamentary general elections
1989 parliamentary election
Results of the 9th parliamentary election held on 15 February 1989:[9]
| Party | Votes per Polling Division | Postal Votes | Total Votes | % | Seats | |||||||||||
|---|---|---|---|---|---|---|---|---|---|---|---|---|---|---|---|---|
| Chavaka -chcheri | Jaffna | Kankesan -thurai | Kayts | Kilino -chchi | Kopay | Manipay | Nallur | Point Pedro | Udu- piddy | Vaddu -koddai | ||||||
| Independent (EROS) | 7,851 | 18,688 | 14,801 | 17,108 | 8,576 | 17,846 | 18,521 | 21,123 | 5,860 | 1,587 | 17,814 | 565 | 150,340 | 62.68% | 8 | |
| Tamil United Liberation Front (ENDLF, EPRLF, TELO, TULF) | 6,350 | 5,323 | 9,073 | 3,706 | 8,850 | 6,717 | 6,048 | 4,211 | 2,428 | 1,178 | 5,827 | 302 | 60,013 | 25.02% | 3 | |
| Sri Lanka Muslim Congress | 553 | 3,387 | 500 | 466 | 669 | 815 | 592 | 410 | 275 | 84 | 682 | 6 | 8,439 | 3.52% | 0 | |
| Democratic People's Liberation Front (PLOTE) | 581 | 409 | 1,199 | 572 | 740 | 1,073 | 1,252 | 531 | 384 | 171 | 1,050 | 31 | 7,993 | 3.33% | 0 | |
| All Ceylon Tamil Congress | 985 | 1,410 | 532 | 391 | 565 | 852 | 535 | 1,137 | 342 | 127 | 541 | 193 | 7,610 | 3.17% | 0 | |
| United National Party (CWC, UNP) | 339 | 470 | 388 | 354 | 1,522 | 421 | 496 | 320 | 569 | 46 | 470 | 65 | 5,460 | 2.28% | 0 | |
| Valid Votes | 16,659 | 29,687 | 26,493 | 22,597 | 20,922 | 27,724 | 27,444 | 27,732 | 9,858 | 3,193 | 26,384 | 1,162 | 239,855 | 100.00% | 11 | |
| Rejected Votes | 3,254 | 1,649 | 2,817 | 2,577 | 3,603 | 2,954 | 2,453 | 1,375 | 894 | 380 | 3,217 | 30 | 25,203 | |||
| Total Polled | 19,913 | 31,336 | 29,310 | 25,174 | 24,525 | 30,678 | 29,897 | 29,107 | 10,752 | 3,573 | 29,601 | 1,192 | 265,058 | |||
| Registered Electors | 51,374 | 49,068 | 60,282 | 49,401 | 53,421 | 56,413 | 58,166 | 61,624 | 40,060 | 51,943 | 58,770 | 1,688 | 592,210 | |||
| Turnout | 38.76% | 63.86% | 48.62% | 50.96% | 45.91% | 54.38% | 51.40% | 47.23% | 26.84% | 6.88% | 50.37% | 70.62% | 44.76% | |||
The following candidates were elected:[9] Eliyathamby Ratnasabapathy (EROS), 40,947 preference votes (pv); Eliyathamby Pararasasingam (EROS), 36,340 pv; S. Sivamaharajah (EROS), 22,622 pv; K. Navaratnam (EPRLF), 22,255 pv; Arunasalam Ponniah Selliah (EROS), 20,747 pv; Suresh Premachandran (EPRLF), 20,738 pv; G. Yogasangari (EPRLF), 20,223 pv; Thambu Loganathapillai (EROS), 17,616 pv; Sebastiyampillai Edward (EROS), 17,429 pv; Kanapathy Selvanayagam (EROS), 14,440 pv; and Joseph George Rajenthiram (EROS), 13,928 pv.
G. Yogasangari (EPRLF) was killed on 19 June 1990.[10]
1994 parliamentary election
Results of the 10th parliamentary election held on 16 August 1994:[11]
| Party | Votes per Polling Division | Postal Votes | Total Votes | % | Seats | |||||||||||
|---|---|---|---|---|---|---|---|---|---|---|---|---|---|---|---|---|
| Chavaka -chcheri | Jaffna | Kankesan -thurai | Kayts | Kilino -chchi | Kopay | Manipay | Nallur | Point Pedro | Udu- piddy | Vaddu -koddai | ||||||
| Independent 2 (EPDP) | 13 | 76 | 93 | 9,944 | 2 | 40 | 4 | 8 | 3 | 5 | 556 | 0 | 10,744 | 79.71% | 9 | |
| Sri Lanka Muslim Congress | 62 | 1,914 | 4 | 56 | 56 | 0 | 0 | 0 | 0 | 1 | 5 | 0 | 2,098 | 15.56% | 1 | |
| Independent 1 (EROS, PLOTE, TELO) | 2 | 26 | 15 | 214 | 6 | 17 | 8 | 9 | 31 | 1 | 43 | 2 | 374 | 2.77% | 0 | |
| Eelam People's Revolutionary Liberation Front | 2 | 6 | 9 | 232 | 2 | 0 | 0 | 2 | 0 | 1 | 8 | 1 | 263 | 1.95% | 0 | |
| Valid Votes | 79 | 2,022 | 121 | 10,446 | 66 | 57 | 12 | 19 | 34 | 8 | 612 | 3 | 13,479 | 100.00% | 10 | |
| Rejected Votes | 3 | 8 | 6 | 302 | 0 | 3 | 1 | 1 | 1 | 0 | 27 | 0 | 352 | |||
| Total Polled | 82 | 2,030 | 127 | 10,748 | 66 | 60 | 13 | 20 | 35 | 8 | 639 | 3 | 13,831 | |||
| Registered Electors | 51,717 | 50,045 | 60,417 | 49,504 | 55,995 | 56,496 | 58,382 | 62,372 | 40,336 | 52,153 | 58,949 | 596,366 | ||||
| Turnout | 0.16% | 4.06% | 0.21% | 21.71% | 0.12% | 0.11% | 0.02% | 0.03% | 0.09% | 0.02% | 1.08% | 2.32% | ||||
The following candidates were elected:[11] Douglas Devananda (EPDP), 2,091 preference votes (pv); Aithurus M. Illias (SLMC), 1,575 pv; Alagaiah Rasamanickam (EPDP), 1,110 pv; Umapathisivam Baskaran (EPDP), 1,056 pv; Rajendran Ramamoorthy (EPDP), 1,050 pv; Nadarajah "Ramesh" Atputharajah (EPDP), 968 pv; Murugesu Chandrakumar (EPDP), 798 pv; Sangarapillai Sivathasan (EPDP), 456 pv; Sinniah Thangavel (EPDP) 398 pv; and M.A. Ghafoor Zafarullah (EPDP), 351 pv.
Nadarajah "Ramesh" Atputharajah (EPDP) was killed on 2 November 1999.[12]
2000 parliamentary election
Results of the 11th parliamentary election held on 10 October 2000:[13]
| Party | Votes per Polling Division | Postal Votes | Displaced Votes | Total Votes | % | Seats | |||||||||||
|---|---|---|---|---|---|---|---|---|---|---|---|---|---|---|---|---|---|
| Chavaka -chcheri | Jaffna | Kankesan -thurai | Kayts | Kilino -chchi | Kopay | Manipay | Nallur | Point Pedro | Udu- piddy | Vaddu -koddai | |||||||
| Eelam People's Democratic Party | 1,256 | 1,571 | 4,068 | 12,311 | 216 | 5,044 | 5,737 | 2,560 | 1,862 | 1,662 | 4,869 | 380 | 135 | 41,671 | 35.00% | 4 | |
| Tamil United Liberation Front | 1,284 | 1,277 | 4,943 | 1,327 | 119 | 4,248 | 5,703 | 3,587 | 1,540 | 4,180 | 4,035 | 518 | 91 | 32,852 | 27.59% | 3 | |
| United National Party (DWC, NWC, UCPF, UNP) | 913 | 581 | 524 | 820 | 278 | 1,051 | 955 | 1,523 | 978 | 1,046 | 2,153 | 74 | 535 | 11,431 | 9.60% | 1 | |
| All Ceylon Tamil Congress | 658 | 394 | 331 | 166 | 43 | 891 | 1,160 | 1,262 | 2,493 | 2,024 | 908 | 288 | 30 | 10,648 | 8.94% | 1 | |
| Independent 2 | 1,043 | 406 | 304 | 223 | 138 | 829 | 872 | 342 | 180 | 328 | 208 | 32 | 2 | 4,907 | 4.12% | 0 | |
| Democratic People's Liberation Front (EROS, PLOTE) | 288 | 471 | 254 | 68 | 24 | 867 | 1,067 | 295 | 705 | 243 | 447 | 49 | 79 | 4,857 | 4.08% | 0 | |
| Left & Democratic Alliance | 46 | 15 | 152 | 6 | 0 | 825 | 124 | 83 | 28 | 73 | 1,079 | 17 | 4 | 2,452 | 2.06% | 0 | |
| Independent 5 | 8 | 6 | 14 | 25 | 2 | 51 | 32 | 24 | 20 | 30 | 29 | 1 | 1,992 | 2,234 | 1.88% | 0 | |
| Independent 6 | 56 | 120 | 43 | 275 | 18 | 110 | 164 | 98 | 123 | 782 | 241 | 28 | 132 | 2,190 | 1.84% | 0 | |
| Independent 1 | 13 | 114 | 174 | 26 | 1 | 548 | 634 | 38 | 19 | 22 | 50 | 2 | 16 | 1,657 | 1.39% | 0 | |
| Independent 3 | 66 | 226 | 77 | 28 | 1 | 241 | 256 | 406 | 59 | 110 | 143 | 20 | 16 | 1,649 | 1.38% | 0 | |
| National Unity Alliance (SLMC et al.) | 5 | 3 | 13 | 17 | 0 | 24 | 39 | 15 | 22 | 22 | 28 | 2 | 825 | 1,015 | 0.85% | 0 | |
| Citizen's Front | 6 | 13 | 27 | 22 | 1 | 44 | 42 | 23 | 29 | 24 | 45 | 0 | 51 | 327 | 0.27% | 0 | |
| Sinhala Heritage | 14 | 7 | 14 | 32 | 0 | 37 | 36 | 18 | 30 | 39 | 38 | 1 | 1 | 267 | 0.22% | 0 | |
| Independent 4 | 0 | 2 | 6 | 7 | 2 | 17 | 6 | 8 | 4 | 5 | 14 | 0 | 116 | 187 | 0.16% | 0 | |
| Janatha Vimukthi Peramuna | 7 | 6 | 14 | 18 | 1 | 27 | 20 | 10 | 9 | 17 | 34 | 0 | 9 | 172 | 0.14% | 0 | |
| Muslim United Liberation Front | 4 | 3 | 3 | 3 | 1 | 12 | 7 | 4 | 3 | 5 | 9 | 0 | 107 | 161 | 0.14% | 0 | |
| Ruhuna People's Party | 2 | 3 | 18 | 8 | 1 | 24 | 24 | 8 | 10 | 16 | 27 | 1 | 0 | 142 | 0.12% | 0 | |
| Sinhalaye Mahasammatha Bhoomiputra Pakshaya | 9 | 7 | 13 | 10 | 2 | 21 | 16 | 6 | 12 | 24 | 14 | 0 | 1 | 135 | 0.11% | 0 | |
| Liberal Party | 3 | 2 | 12 | 5 | 3 | 24 | 18 | 8 | 12 | 13 | 13 | 0 | 2 | 115 | 0.10% | 0 | |
| Valid Votes | 5,681 | 5,227 | 11,004 | 15,397 | 851 | 14,935 | 16,912 | 10,318 | 8,138 | 10,665 | 14,384 | 1,413 | 4,144 | 119,069 | 100.00% | 9 | |
| Rejected Votes | 1,003 | 485 | 1,291 | 935 | 163 | 1,787 | 2,115 | 920 | 1,055 | 1,600 | 2,017 | 13,664 | |||||
| Total Polled | 6,684 | 5,712 | 12,295 | 16,332 | 1,014 | 16,722 | 19,027 | 11,238 | 9,193 | 12,265 | 16,401 | 132,733 | |||||
| Registered Electors | 53,933 | 53,666 | 63,000 | 51,007 | 57,543 | 59,419 | 62,692 | 65,203 | 42,781 | 53,668 | 59,419 | 622,331 | |||||
| Turnout (%) | 12.39% | 10.64% | 19.52% | 32.02% | 1.76% | 28.14% | 30.35% | 17.24% | 21.49% | 22.85% | 27.60% | 21.33% | |||||
The following candidates were elected:[14] V. Anandasangaree (TULF), 12,888 pv; Mavai Senathirajah (TULF), 10,965 pv; Douglas Devananda (EPDP), 7,658 pv; S. Sivamaharajah (TULF), 7,187 pv; T. Maheswaran (UNP), 4,807 pv; Nadarasah Mathanarajah (EPDP), 4,673 pv; Karthigesu Velummylum Kugendran (EPDP), 4,244 pv; A. Vinayagamoorthy (ACTC), 3,825 pv; and Kandiah Sangaran (EPDP), 2,902 pv.
2001 parliamentary election
Results of the 12th parliamentary election held on 5 December 2001:[15][16]
| Party | Votes per Polling Division | Postal Votes | Displaced Votes | Total Votes | % | Seats | |||||||||||
|---|---|---|---|---|---|---|---|---|---|---|---|---|---|---|---|---|---|
| Chavaka -chcheri | Jaffna | Kankesan -thurai | Kayts | Kilino -chchi | Kopay | Manipay | Nallur | Point Pedro | Udu- piddy | Vaddu -koddai | |||||||
| Tamil National Alliance (ACTC, EPRLF(S), TELO, TULF) | 9,865 | 7,368 | 8,898 | 4,304 | 1,100 | 12,539 | 13,539 | 11,787 | 8,525 | 12,493 | 9,800 | 1,496 | 610 | 102,324 | 54.84% | 6 | |
| Eelam People's Democratic Party | 2,221 | 3,647 | 5,580 | 15,378 | 431 | 6,300 | 7,450 | 4,565 | 2,736 | 3,385 | 4,609 | 576 | 330 | 57,208 | 30.66% | 2 | |
| United National Front (CWC, UNP, WPF) | 1,218 | 974 | 1,231 | 764 | 191 | 1,753 | 1,999 | 1,970 | 1,273 | 1,022 | 3,445 | 172 | 233 | 16,245 | 8.71% | 1 | |
| Sri Lanka Muslim Congress | 27 | 299 | 51 | 23 | 3 | 85 | 95 | 334 | 12 | 36 | 35 | 2 | 2,362 | 3,364 | 1.80% | 0 | |
| Independent | 1,045 | 311 | 234 | 24 | 68 | 181 | 349 | 217 | 34 | 126 | 60 | 20 | 8 | 2,677 | 1.43% | 0 | |
| Democratic Left Front | 28 | 20 | 75 | 4 | 0 | 689 | 127 | 82 | 429 | 121 | 461 | 16 | 2 | 2,054 | 1.10% | 0 | |
| Democratic People's Liberation Front (PLOTE) | 79 | 274 | 77 | 19 | 2 | 326 | 215 | 159 | 121 | 55 | 44 | 24 | 59 | 1,454 | 0.78% | 0 | |
| United Socialist Party | 27 | 15 | 29 | 23 | 9 | 46 | 68 | 44 | 30 | 39 | 73 | 0 | 7 | 410 | 0.22% | 0 | |
| New Left Front (NSSP et al.) | 31 | 21 | 34 | 9 | 4 | 70 | 72 | 29 | 26 | 47 | 55 | 0 | 9 | 407 | 0.22% | 0 | |
| Janatha Vimukthi Peramuna | 15 | 12 | 30 | 14 | 1 | 40 | 27 | 21 | 14 | 17 | 48 | 2 | 1 | 242 | 0.13% | 0 | |
| Sinhala Heritage | 20 | 13 | 21 | 22 | 2 | 32 | 28 | 21 | 8 | 23 | 20 | 0 | 3 | 213 | 0.11% | 0 | |
| Valid Votes | 14,576 | 12,954 | 16,260 | 20,584 | 1,811 | 22,061 | 23,969 | 19,229 | 13,208 | 17,364 | 18,650 | 2,308 | 3,624 | 186,598 | 100.00% | 9 | |
| Rejected Votes | 1,264 | 624 | 899 | 777 | 133 | 1,354 | 1,370 | 547 | 823 | 1,084 | 1,478 | 46 | 282 | 10,681 | |||
| Total Polled | 15,840 | 13,578 | 17,159 | 21,361 | 1,944 | 23,415 | 25,339 | 19,776 | 14,031 | 18,448 | 20,128 | 2,354 | 3,906 | 197,279 | |||
| Registered Electors | 54,779 | 55,244 | 64,119 | 51,072 | 57,595 | 61,334 | 64,262 | 67,057 | 43,087 | 53,941 | 60,967 | 633,457 | |||||
| Turnout (%) | 28.92% | 24.58% | 26.76% | 41.83% | 3.38% | 38.18% | 39.43% | 29.49% | 32.56% | 34.20% | 33.01% | 31.14% | |||||
The following candidates were elected:[17] V. Anandasangaree (TNA-TULF), 36,217 preference votes (pv); Mavai Senathirajah (TNA-TULF), 33,831 pv; Gajendrakumar Ponnambalam (TNA-ACTC), 29,641 pv; A. Vinayagamoorthy (TNA-ACTC), 19,472 pv; Nadarajah Raviraj (TNA-TULF), 19,263 pv; M. K. Shivajilingam (TNA-TELO), 17,859 pv; T. Maheswaran (UNF), 11,598 pv; Douglas Devananda (EPDP), 9,744 pv; and Nadarasah Mathanarajah (EPDP), 7,350 pv.
2004 parliamentary election
Results of the 13th parliamentary election held on 2 April 2004:[18]
| Party | Votes per Polling Division | Postal Votes | Displaced Votes | Total Votes | % | Seats | |||||||||||
|---|---|---|---|---|---|---|---|---|---|---|---|---|---|---|---|---|---|
| Chavaka -chcheri | Jaffna | Kankesan -thurai | Kayts | Kilino -chchi | Kopay | Manipay | Nallur | Point Pedro | Udu- piddy | Vaddu -koddai | |||||||
| Tamil National Alliance (ACTC, EPRLF(S), ITAK, TELO) | 30,882 | 16,353 | 18,499 | 13,911 | 29,574 | 26,805 | 23,779 | 22,321 | 22,400 | 24,172 | 24,240 | 3,175 | 1,209 | 257,320 | 90.60% | 8 | |
| Eelam People's Democratic Party | 1,252 | 1,710 | 2,395 | 1,406 | 145 | 2,108 | 3,239 | 2,431 | 676 | 874 | 1,513 | 420 | 443 | 18,612 | 6.55% | 1 | |
| Independent 1 (TULF) | 492 | 360 | 405 | 51 | 171 | 453 | 980 | 800 | 248 | 362 | 485 | 340 | 9 | 5,156 | 1.82% | 0 | |
| Sri Lanka Muslim Congress | 8 | 151 | 7 | 41 | 5 | 16 | 11 | 14 | 2 | 13 | 9 | 1 | 1,717 | 1,995 | 0.70% | 0 | |
| United Socialist Party | 24 | 6 | 27 | 14 | 18 | 32 | 36 | 32 | 22 | 25 | 42 | 1 | 12 | 291 | 0.10% | 0 | |
| New Left Front (NSSP et al.) | 19 | 13 | 25 | 11 | 6 | 36 | 54 | 30 | 9 | 23 | 32 | 7 | 1 | 266 | 0.09% | 0 | |
| Independent 2 | 24 | 17 | 8 | 8 | 6 | 15 | 22 | 14 | 6 | 15 | 15 | 0 | 1 | 151 | 0.05% | 0 | |
| Jathika Hela Urumaya | 9 | 4 | 5 | 4 | 8 | 12 | 20 | 5 | 5 | 12 | 9 | 1 | 1 | 95 | 0.03% | 0 | |
| Swarajya | 6 | 11 | 8 | 3 | 2 | 9 | 11 | 5 | 1 | 6 | 7 | 1 | 3 | 73 | 0.03% | 0 | |
| Ruhuna People's Party | 8 | 5 | 7 | 5 | 4 | 9 | 6 | 7 | 3 | 5 | 6 | 0 | 2 | 67 | 0.02% | 0 | |
| Valid Votes | 32,724 | 18,630 | 21,386 | 15,454 | 29,939 | 29,495 | 28,158 | 25,659 | 23,372 | 25,507 | 26,358 | 3,946 | 3,398 | 284,026 | 100.00% | 9 | |
| Rejected Votes | 2,966 | 1,120 | 1,631 | 1,282 | 2,213 | 2,445 | 2,268 | 1,465 | 1,028 | 1,956 | 2,543 | 39 | 277 | 21,233 | |||
| Total Polled | 35,690 | 19,750 | 23,017 | 16,736 | 32,152 | 31,940 | 30,426 | 27,124 | 24,400 | 27,463 | 28,901 | 3,985 | 3,675 | 305,259 | |||
| Registered Electors | 57,379 | 57,460 | 64,434 | 51,911 | 57,975 | 61,403 | 65,218 | 67,672 | 45,457 | 54,087 | 61,283 | 644,279 | |||||
| Turnout (%) | 62.20% | 34.37% | 35.72% | 32.24% | 55.46% | 52.02% | 46.65% | 40.08% | 53.68% | 50.78% | 47.16% | 47.38% | |||||
The following candidates were elected:[19] Selvarajah Kajendren (TNA), 112,077 preference votes (pv); Pathmini Sithamparanathan (TNA), 68,240 pv; Gajendrakumar Ponnambalam (TNA-ACTC), 60,770 pv; Suresh Premachandran (TNA-EPRLF), 45,786 pv; K. Sivanesan (TNA), 43,730 pv; Nadarajah Raviraj (TNA-ITAK), 42,965 pv; M. K. Shivajilingam (TNA-TELO), 42,193 pv; Mavai Senathirajah (TNA-ITAK), 38,783 pv; and Douglas Devananda (EPDP), 9,405 pv.
Nadarajah Raviraj (TNA-ITAK) was killed on 10 November 2006.[20] His replacement Nallathamby Srikantha (TNA-TELO) was sworn in on 30 November 2006.[21]
K. Sivanesan (TNA) was killed on 6 March 2008.[22] His replacement Solomon Cyril (TNA) was sworn in on 9 April 2008.[23]
2010 parliamentary election
Results of the 14th parliamentary election held on 8 April 2010:[24]
| Party | Votes per Polling Division | Postal Votes | Displaced Votes | Total Votes | % | Seats | |||||||||||
|---|---|---|---|---|---|---|---|---|---|---|---|---|---|---|---|---|---|
| Chavaka -chcheri | Jaffna | Kankesan -thurai | Kayts | Kilino -chchi | Kopay | Manipay | Nallur | Point Pedro | Udu- piddy | Vaddu -koddai | |||||||
| Tamil National Alliance (EPRLF(S), ITAK, TELO) | 7,664 | 4,713 | 5,018 | 1,671 | 4,192 | 7,467 | 7,194 | 7,490 | 3,783 | 4,630 | 5,341 | 3,813 | 2,143 | 65,119 | 43.85% | 5 | |
| United People's Freedom Alliance (ACMC, EPDP, SLFP et al.) | 2,777 | 3,479 | 4,518 | 6,441 | 3,367 | 4,377 | 5,643 | 3,467 | 3,402 | 2,533 | 3,286 | 1,529 | 2,803 | 47,622 | 32.07% | 3 | |
| United National Front (DPF, SLFP(P), SLMC, UNP) | 1,248 | 616 | 584 | 392 | 386 | 1,122 | 1,424 | 896 | 697 | 717 | 3,438 | 461 | 643 | 12,624 | 8.50% | 1 | |
| Tamil National People's Front (ACTC et al.) | 445 | 688 | 337 | 104 | 85 | 370 | 397 | 730 | 1,123 | 760 | 831 | 474 | 18 | 6,362 | 4.28% | 0 | |
| Tamil United Liberation Front | 298 | 130 | 169 | 33 | 497 | 165 | 473 | 188 | 98 | 228 | 388 | 176 | 49 | 2,892 | 1.95% | 0 | |
| Independent 11 | 315 | 41 | 206 | 72 | 25 | 410 | 296 | 141 | 264 | 261 | 505 | 26 | 0 | 2,562 | 1.73% | 0 | |
| Independent 4 | 574 | 39 | 144 | 9 | 11 | 215 | 332 | 194 | 79 | 257 | 252 | 41 | 4 | 2,151 | 1.45% | 0 | |
| Eelam People's Revolutionary Liberation Front (Padmanaba) | 563 | 92 | 112 | 25 | 201 | 311 | 268 | 62 | 9 | 34 | 115 | 27 | 2 | 1,821 | 1.23% | 0 | |
| Independent 3 | 112 | 22 | 57 | 12 | 9 | 223 | 115 | 98 | 214 | 171 | 57 | 69 | 2 | 1,161 | 0.78% | 0 | |
| Independent 6 | 15 | 4 | 168 | 2 | 7 | 451 | 59 | 46 | 19 | 75 | 171 | 21 | 0 | 1,038 | 0.70% | 0 | |
| Left Liberation Front (LLF, TNLA) | 30 | 56 | 42 | 45 | 3 | 37 | 79 | 47 | 49 | 314 | 125 | 39 | 2 | 868 | 0.58% | 0 | |
| Eelavar Democratic Front (EROS) | 79 | 92 | 54 | 27 | 57 | 104 | 96 | 67 | 37 | 43 | 161 | 7 | 34 | 858 | 0.58% | 0 | |
| Democratic Unity Alliance | 19 | 28 | 20 | 22 | 255 | 81 | 50 | 70 | 21 | 29 | 91 | 9 | 69 | 764 | 0.51% | 0 | |
| Independent 5 | 17 | 36 | 30 | 18 | 6 | 64 | 66 | 73 | 16 | 53 | 46 | 11 | 1 | 437 | 0.29% | 0 | |
| Independent 10 | 20 | 19 | 14 | 11 | 60 | 33 | 37 | 52 | 6 | 9 | 82 | 36 | 20 | 399 | 0.27% | 0 | |
| United Socialist Party | 100 | 15 | 9 | 7 | 8 | 28 | 21 | 23 | 9 | 10 | 40 | 7 | 3 | 280 | 0.19% | 0 | |
| Independent 7 | 6 | 1 | 11 | 0 | 7 | 75 | 15 | 6 | 15 | 109 | 6 | 10 | 0 | 261 | 0.18% | 0 | |
| Democratic National Alliance (JVP et al.) | 10 | 12 | 13 | 1 | 9 | 28 | 17 | 17 | 3 | 22 | 19 | 4 | 46 | 201 | 0.14% | 0 | |
| Independent 1 | 17 | 29 | 4 | 2 | 4 | 18 | 9 | 30 | 18 | 34 | 11 | 4 | 3 | 183 | 0.12% | 0 | |
| Independent 2 | 72 | 8 | 4 | 2 | 2 | 13 | 11 | 8 | 12 | 19 | 20 | 4 | 4 | 179 | 0.12% | 0 | |
| Independent 9 | 37 | 5 | 10 | 1 | 10 | 31 | 17 | 11 | 2 | 5 | 29 | 3 | 10 | 171 | 0.12% | 0 | |
| Janasetha Peramuna | 11 | 16 | 8 | 5 | 0 | 12 | 12 | 16 | 21 | 7 | 24 | 2 | 0 | 134 | 0.09% | 0 | |
| Independent 12 | 12 | 7 | 3 | 5 | 2 | 16 | 9 | 7 | 3 | 9 | 12 | 2 | 22 | 109 | 0.07% | 0 | |
| Socialist Equality Party | 5 | 8 | 5 | 27 | 3 | 8 | 11 | 2 | 0 | 6 | 22 | 4 | 0 | 101 | 0.07% | 0 | |
| Independent 8 | 11 | 2 | 2 | 8 | 1 | 15 | 12 | 7 | 9 | 5 | 19 | 2 | 0 | 93 | 0.06% | 0 | |
| Tamil Makkal Viduthalai Pulikal | 9 | 5 | 6 | 5 | 4 | 6 | 6 | 4 | 7 | 3 | 10 | 0 | 4 | 69 | 0.05% | 0 | |
| All Are Citizens, All Are Kings Organisation | 10 | 0 | 1 | 0 | 1 | 4 | 10 | 5 | 2 | 4 | 7 | 0 | 0 | 44 | 0.03% | 0 | |
| Valid Votes | 14,476 | 10,163 | 11,549 | 8,947 | 9,212 | 15,684 | 16,679 | 13,757 | 9,918 | 10,347 | 15,108 | 6,781 | 5,882 | 148,503 | 100.00% | 9 | |
| Rejected Votes | 2,180 | 1,037 | 1,621 | 1,326 | 1,807 | 2,021 | 2,239 | 1,334 | 1,194 | 1,485 | 2,128 | 314 | 1,088 | 19,774 | |||
| Total Polled | 16,656 | 11,200 | 13,170 | 10,273 | 11,019 | 17,705 | 18,918 | 15,091 | 11,112 | 11,832 | 17,236 | 7,095 | 6,970 | 168,277 | |||
| Registered Electors | 65,141 | 64,714 | 69,082 | 53,111 | 90,811 | 65,798 | 71,114 | 72,558 | 48,613 | 56,426 | 63,991 | 721,359 | |||||
| Turnout | 25.57% | 17.31% | 19.06% | 19.34% | 12.13% | 26.91% | 26.60% | 20.80% | 22.86% | 20.97% | 26.94% | 23.33% | |||||
The following candidates were elected:[25] Douglas Devananda (UPFA-EPDP), 28,585 preference votes (pv); Mavai Senathirajah (TNA-ITAK), 20,501 pv; Suresh Premachandran (TNA-EPRLF), 16,425 pv; A. Vinayagamoorthy (TNA), 15,311 pv; E. Saravanapavan (TNA), 14,961 pv; Silvestri Alantine (UPFA-EPDP), 13,128 pv; S. Sritharan (TNA), 10,057; Murugesu Chandrakumar (UPFA-EPDP), 8,105 pv; and Vijayakala Maheswaran (UNF-UNP), 7,160 pv.
Provincial Council Elections
1988 provincial council election
Results of the 1st North Eastern provincial council election held on 19 November 1988:
Jaffna District - The Eelam People's Revolutionary Liberation Front won all 19 seats uncontested.[26]
Kilinochchi District - The Eelam National Democratic Liberation Front won all 3 seats uncontested.[26]
2013 provincial council election
Results of the 1st Northern provincial council election held on 21 September 2013:[27][28]
Jaffna District
| Party | Votes per Polling Division | Postal Votes | Total Votes | % | Seats | ||||||||||
|---|---|---|---|---|---|---|---|---|---|---|---|---|---|---|---|
| Chavaka -chcheri | Jaffna | Kankesan -thurai | Kayts | Kopay | Manipay | Nallur | Point Pedro | Udu- piddy | Vaddu -koddai | ||||||
| Tamil National Alliance (EPRLF (S), ITAK, PLOTE, TELO, TULF) | 22,922 | 16,421 | 19,596 | 8,917 | 26,467 | 28,210 | 23,733 | 17,719 | 18,855 | 23,442 | 7,625 | 213,907 | 84.37% | 14 | |
| United People's Freedom Alliance (ACMC, EPDP, SLFP et al.) | 4,193 | 2,416 | 4,048 | 4,164 | 4,386 | 3,898 | 2,651 | 2,953 | 2,424 | 3,763 | 1,099 | 35,995 | 14.20% | 2 | |
| United National Party | 89 | 60 | 35 | 17 | 127 | 88 | 148 | 26 | 57 | 173 | 35 | 855 | 0.34% | 0 | |
| Democratic Unity Alliance | 31 | 21 | 41 | 21 | 53 | 54 | 62 | 162 | 27 | 43 | 10 | 525 | 0.21% | 0 | |
| Independent 1 | 25 | 40 | 24 | 3 | 80 | 33 | 38 | 80 | 54 | 19 | 10 | 406 | 0.16% | 0 | |
| Independent 6 | 7 | 7 | 42 | 1 | 88 | 109 | 22 | 2 | 35 | 27 | 16 | 356 | 0.14% | 0 | |
| Sri Lanka People's Party | 61 | 18 | 19 | 16 | 71 | 17 | 22 | 20 | 6 | 38 | 4 | 292 | 0.12% | 0 | |
| Independent 7 | 10 | 34 | 62 | 8 | 18 | 19 | 18 | 3 | 1 | 86 | 12 | 271 | 0.11% | 0 | |
| Independent 3 | 6 | 10 | 17 | 15 | 20 | 62 | 10 | 11 | 9 | 50 | 5 | 215 | 0.08% | 0 | |
| United Socialist Party | 27 | 6 | 20 | 11 | 34 | 14 | 14 | 10 | 11 | 18 | 0 | 165 | 0.07% | 0 | |
| Democratic Party | 10 | 4 | 5 | 1 | 10 | 35 | 19 | 7 | 3 | 14 | 3 | 111 | 0.04% | 0 | |
| Socialist Equality Party | 4 | 5 | 7 | 29 | 7 | 8 | 7 | 0 | 3 | 26 | 5 | 101 | 0.04% | 0 | |
| Janasetha Peramuna | 11 | 2 | 2 | 2 | 3 | 3 | 3 | 23 | 13 | 6 | 6 | 74 | 0.03% | 0 | |
| Independent 9 | 3 | 8 | 10 | 6 | 10 | 2 | 3 | 6 | 6 | 8 | 1 | 63 | 0.02% | 0 | |
| Independent 8 | 7 | 4 | 11 | 8 | 7 | 7 | 3 | 3 | 1 | 7 | 1 | 59 | 0.02% | 0 | |
| Janatha Vimukthi Peramuna | 2 | 3 | 4 | 5 | 9 | 9 | 10 | 3 | 1 | 7 | 3 | 56 | 0.02% | 0 | |
| Independent 4 | 3 | 3 | 1 | 0 | 4 | 6 | 2 | 5 | 2 | 2 | 0 | 28 | 0.01% | 0 | |
| Independent 2 | 0 | 0 | 2 | 0 | 5 | 6 | 3 | 0 | 3 | 5 | 0 | 24 | 0.01% | 0 | |
| Independent 5 | 1 | 1 | 1 | 2 | 9 | 4 | 1 | 2 | 0 | 2 | 0 | 23 | 0.01% | 0 | |
| Sri Lanka Labour Party | 3 | 0 | 0 | 1 | 3 | 1 | 5 | 3 | 0 | 0 | 0 | 16 | 0.01% | 0 | |
| Valid Votes | 27,415 | 19,063 | 23,947 | 13,227 | 31,411 | 32,585 | 26,774 | 21,038 | 21,511 | 27,736 | 8,835 | 253,542 | 100.00% | 16 | |
| Rejected Votes | 2,378 | 1,240 | 2,074 | 1,377 | 3,195 | 2,531 | 1,650 | 1,444 | 1,755 | 2,521 | 114 | 20,279 | |||
| Total Polled | 29,793 | 20,303 | 26,021 | 14,604 | 34,606 | 35,116 | 28,424 | 22,482 | 23,266 | 30,257 | 8,949 | 273,821 | |||
| Registered Electors | 49,479 | 28,610 | 61,196 | 21,548 | 53,617 | 51,722 | 42,466 | 35,054 | 37,926 | 45,195 | 426,813 | ||||
| Turnout | 60.21% | 70.96% | 42.52% | 67.77% | 64.54% | 67.89% | 66.93% | 64.14% | 61.35% | 66.95% | 64.15% | ||||
Kilinochchi District
| Party | Kilino -chchi | Postal Votes | Total Votes | % | Seats | |
|---|---|---|---|---|---|---|
| Tamil National Alliance (EPRLF (S), ITAK, PLOTE, TELO, TULF) | 36,323 | 756 | 37,079 | 81.57% | 3 | |
| United People's Freedom Alliance (ACMC, EPDP, SLFP et al.) | 7,737 | 160 | 7,897 | 17.37% | 1 | |
| Eelavar Democratic Front (EROS) | 300 | 0 | 300 | 0.66% | 0 | |
| Democratic Unity Alliance | 60 | 1 | 61 | 0.13% | 0 | |
| United National Party | 53 | 1 | 54 | 0.12% | 0 | |
| Independent 2 | 22 | 0 | 22 | 0.05% | 0 | |
| Janatha Vimukthi Peramuna | 18 | 0 | 18 | 0.04% | 0 | |
| Independent 1 | 7 | 0 | 7 | 0.02% | 0 | |
| United Lanka Great Council | 6 | 0 | 6 | 0.01% | 0 | |
| Democratic Party | 5 | 0 | 5 | 0.01% | 0 | |
| Nationalities Unity Organisation | 4 | 0 | 4 | 0.01% | 0 | |
| Sri Lanka Labour Party | 3 | 1 | 4 | 0.01% | 0 | |
| Janasetha Peramuna | 2 | 0 | 2 | 0.00% | 0 | |
| Valid Votes | 44,540 | 919 | 45,459 | 17.93% | 4 | |
| Rejected Votes | 4,725 | 10 | 4,735 | |||
| Total Polled | 49,265 | 929 | 50,194 | |||
| Registered Electors | 68,600 | 68,600 | ||||
| Turnout | 71.81% | 73.17% | ||||
References
- ↑ "A2 : Population by ethnic group according to districts, 2012". Census of Population & Housing, 2011. Department of Census & Statistics, Sri Lanka.
- 1 2 3 "Presidential Election 08-01-2015 Jaffna District". Department of Elections, Sri Lanka.
- ↑ "Result of Presidential Election 1982" (PDF). Department of Elections, Sri Lanka.
- ↑ "Result of Presidential Election 1988" (PDF). Department of Elections, Sri Lanka.
- ↑ "Result of Presidential Election 1994" (PDF). Department of Elections, Sri Lanka.
- ↑ "Result of Presidential Election 1999" (PDF). Department of Elections, Sri Lanka.
- ↑ "Result of Presidential Election 2005 (District)" (PDF). Department of Elections, Sri Lanka.
- ↑ "Presidential Election - 2010 Jaffna District". Department of Elections, Sri Lanka.
- 1 2 "Result of Parliamentary General Election 1989" (PDF). Department of Elections, Sri Lanka.
- ↑ Parthasarathy, R. (15 July 1990). "A Massacre in Madras". Tamil Times. IX (8): 9. ISSN 0266-4488.
- 1 2 "Result of Parliamentary General Election 1994" (PDF). Department of Elections, Sri Lanka.
- ↑ "Thinamurasu chief editor killed". TamilNet. 2 November 1999.
- ↑ "Parliamentary General Election 10.10.2000 - Jaffna District". Department of Elections, Sri Lanka.
- ↑ "General Election 2000 Preferences" (PDF). Department of Elections, Sri Lanka.
- ↑ "Parliamentary General Election 2001 Final District Results - Jaffna District". Department of Elections, Sri Lanka.
- ↑ "Jaffna District Polling Divisions" (PDF). Department of Elections, Sri Lanka.
- ↑ "General Election 2001 Preferences" (PDF). Department of Elections, Sri Lanka.
- ↑ "Parliamentary General Election 2004 Final District Results - Jaffna District". Department of Elections, Sri Lanka.
- ↑ "General Election 2004 Preferences" (PDF). Department of Elections, Sri Lanka.
- ↑ "Sri Lankan MP killed in Colombo". BBC News. 10 November 2006.
- ↑ "New TNA parliamentarian takes oath". TamilNet. 30 November 2006.
- ↑ "Tamil MP is killed in Sri Lanka". BBC News. 6 March 2008.
- ↑ "Two new parliamentarians sworn in". TamilNet. 9 April 2008.
- ↑ "Parliamentary General Election - 2010 Jaffna District". Department of Elections, Sri Lanka.
- ↑ "Parliamentary General Election - 2010 Jaffna Preferences" (PDF). Department of Elections, Sri Lanka.
- 1 2 "Election Results" (PDF). Tamil Times. VIII (1): 4. December 1988. ISSN 0266-4488.
- ↑ "Provincial Council Elections 2013 : Jaffna District". Department of Elections, Sri Lanka.
- ↑ "Provincial Council Elections 2013 : Kilinochchi District". Department of Elections, Sri Lanka.
| History | 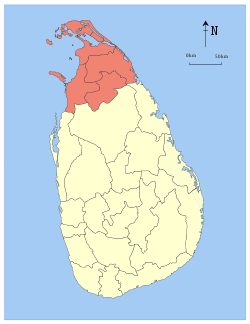 | ||||||||||||||||||
|---|---|---|---|---|---|---|---|---|---|---|---|---|---|---|---|---|---|---|---|
| Geography |
| ||||||||||||||||||
| Politics | |||||||||||||||||||
| Economy |
| ||||||||||||||||||
| Society |
| ||||||||||||||||||
| Symbols |
| ||||||||||||||||||