Iowa's 2nd congressional district
| Iowa's 2nd congressional district | ||
|---|---|---|
.tif.png) | ||
| Current Representative | David Loebsack (D–Iowa City) | |
| Distribution | 66.06% urban, 33.94% rural | |
| Population (2000) | 585,241[1] | |
| Median income | $40,121[1] | |
| Ethnicity | 93.7% White, 2.0% Black, 1.5% Asian, 2.7% Hispanic, 0.2% Native American | |
| Cook PVI | D+4[2] | |
Iowa's 2nd congressional district is a congressional district in the U.S. state of Iowa that generally covers most of the southeastern part of the state including Davenport, Iowa City, Muscatine, Clinton, Burlington, and Fort Madison.
The district is currently represented by Democrat Dave Loebsack.
Redistricting
On June 22, 2001, the Iowa Legislature passed a plan to redistrict the state of Iowa. The plan went into effect in 2002 for the 108th U.S. Congress. The prior redistricting plan was effective from 1992-2001.[3]
List of representatives
| Representative | Party | Term | District Residence | Note |
|---|---|---|---|---|
| District created |
March 4, 1847 | |||
 Shepherd Leffler Shepherd Leffler |
Democratic | March 4, 1847 – March 3, 1851 | Redistricted from the At-large district | |
| Lincoln Clark |
Democratic | March 4, 1851 – March 3, 1853 | ||
| John P. Cook |
March 4, 1853 – March 3, 1855 | |||
 James Thorington James Thorington |
March 4, 1855 – March 3, 1857 | |||
| Timothy Davis |
Republican | March 4, 1857 – March 3, 1859 | ||
 William Vandever William Vandever |
Republican | March 4, 1859 – March 3, 1863 | ||
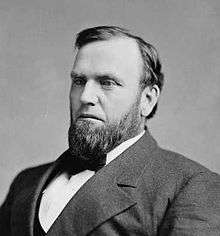
 Hiram Price Hiram Price |
Republican | March 4, 1863 – March 3, 1869 | ||
 William Smyth William Smyth |
Republican | March 4, 1869 – September 30, 1870 | Died | |
| Vacant |
September 30, 1870 - December 6, 1870 | |||
| William P. Wolf |
Republican | December 6, 1870 – March 3, 1871 | ||
 Aylett R. Cotton Aylett R. Cotton |
Republican | March 4, 1871 – March 3, 1875 | ||
 John Q. Tufts John Q. Tufts |
Republican | March 4, 1875 – March 3, 1877 | ||
| Hiram Price |
Republican | March 4, 1877 – March 3, 1881 | ||
| Sewall S. Farwell |
Republican | March 4, 1881 – March 3, 1883 | ||
| Jeremiah H. Murphy |
Democratic | March 4, 1883 – March 3, 1887 | ||
 Walter I. Hayes Walter I. Hayes |
Democratic | March 4, 1887 – March 3, 1895 | ||
 George M. Curtis George M. Curtis |
Republican | March 4, 1895 – March 3, 1899 | ||
 Joseph R. Lane Joseph R. Lane |
Republican | March 4, 1899 – March 3, 1901 | ||
| John N. W. Rumple |
Republican | March 4, 1901 – January 31, 1903 | Died | |
| Vacant |
January 31, 1903 - March 4, 1903 | |||
 Martin J. Wade Martin J. Wade |
Democratic | March 4, 1903 – March 3, 1905 | ||
| Albert F. Dawson |
Republican | March 4, 1905 – March 3, 1911 | ||
 Irvin S. Pepper Irvin S. Pepper |
Democratic | March 4, 1911 – December 22, 1913 | Died | |
| Vacant |
December 22, 1913 - February 10, 1914 | |||
.jpg) Henry Vollmer Henry Vollmer |
Democratic | February 10, 1914 – March 3, 1915 | ||
 Harry E. Hull Harry E. Hull |
Republican | March 4, 1915 – March 3, 1925 | ||
| F. Dickinson Letts |
Republican | March 4, 1925 – March 3, 1931 | ||
| Bernhard M. Jacobsen |
Democratic | March 4, 1931 – June 30, 1936 | Died | |
| Vacant |
June 30, 1936 - January 3, 1937 | |||
 William S. Jacobsen William S. Jacobsen |
Democratic | January 3, 1937 – January 3, 1943 | ||
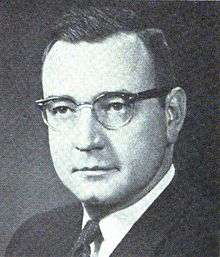
| Henry O. Talle |
Republican | January 3, 1943 – January 3, 1959 | Redistricted from the 4th district | |
| Leonard G. Wolf |
Democratic | January 3, 1959 – January 3, 1961 | ||
 James E. Bromwell James E. Bromwell |
Republican | January 3, 1961 – January 3, 1965 | ||
 John Culver John Culver |
Democratic | January 3, 1965 - January 3, 1975 | ||
 Mike Blouin Mike Blouin |
Democratic | January 3, 1975 - January 3, 1979 | ||
 Tom Tauke Tom Tauke |
Republican | January 3, 1979 – January 3, 1991 | ||
 Jim Nussle Jim Nussle |
Republican | January 3, 1991 – January 3, 2003 | Redistricted to the 1st district | |
 Jim Leach Jim Leach |
Republican | January 3, 2003 – January 3, 2007 | Redistricted from the 1st district | |
 David Loebsack David Loebsack |
Democratic | January 3, 2007 – Present | Incumbent | |
Historical Election Results
| Year[4]
|
Party Affiliation | Winner | Number of Votes | Party Affiliation | Loser | Number of Votes | Percentage of Votes |
|---|---|---|---|---|---|---|---|
| 1920 | Republican | Harry E. Hull | 50,160 | Farmer-Labor | F.B Althouse | 6,058 | 89% - 11% |
| 1922 | Republican | Harry E. Hull | 27,450 | Democrat | Wayne G. Cook | 25,620 | 51% - 48% |
| 1924 | Republican | Fred Dickinson Letts | 49,117 | Democrat | Ralph U. Thompson | 32,893 | 60% - 40% |
| 1926 | Republican | Fred Dickinson Letts | 29,200 | Democrat | J. P. Gallagher | 19,612 | 60% - 40% |
| 1928 | Republican | Fred Dickinson Letts | 49,690 | Democrat | Frank Z. Titzell | 37,344 | 57% - 43% |
| 1930 | Democrat | Bernhard M. Jacobsen | 30,008 | Republican | F. D. Letts | 24,113 | 55% - 45% |
| 1932 | Democrat | Bernhard M. Jacobsen | 71,914 | Republican | Frank W. Elliott | 50,636 | 59% - 41% |
| 1934 | Democrat | Bernhard M. Jacobsen | 60,654 | Republican | Martin B. Andelfinger | 39,047 | 63% - 35% |
| 1936 | Democrat | William S. Jacobsen | 70,923 | Republican | Charles Penningroth | 55,255 | 53% - 41% |
| 1938 | Democrat | William S. Jacobsen | 48,155 | Republican | Alfred C. Mueller | 47,535 | 50.3% - 49.7% |
| 1940 | Democrat | William S. Jacobsen | 75,774 | Republican | W. A. McCullough | 69,298 | 52% - 48% |
| 1942 | Republican | Henry O. Talle | 62,290 | Democrat | William S. Jacobsen | 46,310 | 57% - 43% |
| 1944 | Republican | Henry O. Talle | 86,903 | Democrat | George C. Classen | 68,489 | 56% - 44% |
| 1946 | Republican | Henry O. Talle | 60,111 | Democrat | Richard V. Bernhart | 41,544 | 59% - 41% |
| 1948 | Republican | Henry O. Talle | 82,139 | Democrat | T. W. Mullaney | 60,272 | 57% - 42% |
| 1950 | Republican | Henry O. Talle | 79,066 | Democrat | Eugene J. Kean | 55,359 | 59% - 41% |
| 1952 | Republican | Henry O. Talle | 114,553 | Democrat | T. W. Mullaney | 69,421 | 62% - 38% |
| 1954 | Republican | Henry O. Talle | 72,231 | Democrat | Ruben V. Austin | 58,092 | 55% - 46% |
| 1956 | Republican | Henry O. Talle | 95,999 | Democrat | Leonard G. Wolf | 90,843 | 51% - 49% |
| 1958 | Democrat | Leonard G. Wolf | 67,022 | Republican | Henry O. Talle | 64,073 | 51% - 49% |
| 1960 | Republican | James E. Bromwell | 108,137 | Democrat | Leonard G. Wolf | 97,608 | 53% - 47% |
| 1962 | Republican | James E. Bromwell | 67,475 | Democrat | Frank W. Less | 60,296 | 53% - 47% |
| 1964 | Democrat | John C. Culver | 97,470 | Republican | James E. Bromwell | 89,299 | 52% - 48% |
| 1966 | Democrat | John C. Culver | 76,281 | Republican | Robert M. L. Johnson | 65,079 | 54% - 46% |
| 1968 | Democrat | John C. Culver | 103,651 | Republican | Tom Riley | 84,634 | 55% - 45% |
| 1970 | Democrat | John C. Culver | 84,049 | Republican | Cole McMartin | 54,934 | 60% - 40% |
| 1972 | Democrat | John C. Culver | 115,489 | Republican | Theodore R. Ellsworth | 79,667 | 59% - 41% |
| 1974 | Democrat | Michael T. Blouin | 73,416 | Republican | Tom Riley | 69,088 | 51% - 48% |
| 1976 | Democrat | Michael T. Blouin | 102,980 | Republican | Tom Riley | 100,344 | 50% - 49% |
| 1978 | Republican | Thomas J. Tauke | 72,644 | Democrat | Michael T. Blouin | 65,450 | 52% - 47% |
| 1980 | Republican | Thomas J. Tauke | 111,587 | Democrat | Steve Sovern | 93,175 | 54% - 45% |
| 1982 | Republican | Thomas J. Tauke | 99,478 | Democrat | Brent Appel | 69,539 | 59% - 41% |
| 1984 | Republican | Thomas J. Tauke | 136,839 | Democrat | Joe Welsh | 77,335 | 64% - 36% |
| 1986 | Republican | Thomas J. Tauke | 88,708 | Democrat | Eric Tabor | 55,903 | 61% - 39% |
| 1988 | Republican | Thomas J. Tauke | 113,543 | Democrat | Eric Tabor | 86,438 | 58% - 43% |
| 1990 | Republican | Jim Nussle | 82,650 | Democrat | Eric Tabor | 81,008 | 50% - 49% |
| 1992 | Republican | Jim Nussle | 134,536 | Democrat | David R. Nagle | 131,570 | 50% - 49% |
| 1994 | Republican | Jim Nussle | 111,076 | Democrat | David R. Nagle | 86,087 | 56% - 43% |
| 1996 | Republican | Jim Nussle | 127,827 | Democrat | Donna L. Smith | 109,731 | 53% - 46% |
| 1998 | Republican | Jim Nussle | 104,613 | Democrat | Rob Tully | 83,405 | 55% - 44% |
| 2000 | Republican | Jim Nussle | 139,906 | Democrat | Donna L. Smith | 110,327 | 55% - 44% |
| 2002 | Republican | James A. Leach | 108,130 | Democrat | Julie Thomas | 94,767 | 52% - 46% |
| 2004 | Republican | James A. Leach | 176,684 | Democrat | Dave Franker | 117,405 | 59% - 39% |
| 2006 | Democrat | Dave Loebsack | 107,097 | Republican | James A. Leach | 101,386 | 51% - 49% |
| 2008 | Democrat | Dave Loebsack | 173,639 | Republican | Mariannette Miller-Meeks | 118,040 | 57% - 38% |
| 2010 | Democrat | Dave Loebsack | 115,839 | Republican | Mariannette Miller-Meeks | 104,319 | 50% - 45% |
Recent Election Results
2002
| Party | Candidate | Votes | % | |
|---|---|---|---|---|
| Republican | James A. Leach | 108,130 | 52.19 | |
| Democratic | Julie Thomas | 94,767 | 45.74 | |
| Libertarian | Kevin Litten | 4,178 | 2.02 | |
| No party | Others | 96 | 0.05% | |
| Total votes | 207,171 | 100.00 | ||
| Voter turnout | % | |||
| Republican hold | ||||
2004
| Party | Candidate | Votes | % | |
|---|---|---|---|---|
| Republican | James A. Leach* | 176,684 | 58.92 | |
| Democratic | Dave Franker | 117,405 | 39.15 | |
| Libertarian | Kevin Litten | 5,586 | 1.86 | |
| No party | Others | 206 | 0.07% | |
| Total votes | 299,881 | 100.00 | ||
| Voter turnout | % | |||
| Republican hold | ||||
2006
| Party | Candidate | Votes | % | |||
|---|---|---|---|---|---|---|
| Democratic | Dave Loebsack | 107,683 | 51.38 | |||
| Republican | James A. Leach* | 101,707 | 48.53 | |||
| No party | Others | 196 | 0.09% | |||
| Total votes | 209,586 | 100.00 | ||||
| Voter turnout | % | |||||
| Democratic gain from Republican | ||||||
2008
| Party | Candidate | Votes | % | |
|---|---|---|---|---|
| Democratic | Dave Loebsack* | 175,218 | 57.19 | |
| Republican | Mariannette Miller-Meeks | 118,778 | 38.77 | |
| Green | Wendy Barth | 6,664 | 2.18 | |
| Independent | Brian White | 5,437 | 1.78 | |
| No party | Others | 261 | 0.09% | |
| Total votes | 306,358 | 100.00 | ||
| Voter turnout | % | |||
| Democratic hold | ||||
2010
| Party | Candidate | Votes | % | |
|---|---|---|---|---|
| Democratic | Dave Loebsack* | 115,839 | 50.99 | |
| Republican | Mariannette Miller-Meeks | 104,319 | 45.92 | |
| Libertarian | Gary Joseph Sicard | 4,356 | 1.92 | |
| Constitution | Jon Tack | 2,463 | 1.08 | |
| No party | Others | 198 | 0.09% | |
| Total votes | 227,175 | 100.00 | ||
| Voter turnout | % | |||
| Democratic hold | ||||
2012
| Party | Candidate | Votes | % | |
|---|---|---|---|---|
| Democratic | Dave Loebsack* | 211,863 | 55.57 | |
| Republican | John Archer | 161,977 | 42.48 | |
| Independent | Alan Aversa | 7,112 | 1.87 | |
| No party | Others | 323 | 0.08% | |
| Total votes | 381,275 | 100.00 | ||
| Voter turnout | % | |||
| Democratic hold | ||||
2014
| Party | Candidate | Votes | % | |
|---|---|---|---|---|
| Democratic | Dave Loebsack* | 143,431 | 52.5 | |
| Republican | Mariannette Miller-Meeks | 129,455 | 47.4 | |
| Write-ins | 443 | 0.2 | ||
| Total votes | 273,329 | 100 | ||
| Democratic hold | ||||
Living former Members of the U.S. House of Representatives from Iowa's 2nd congressional district
As of May 2015, five former members of the U.S. House of Representatives from Iowa's 2nd congressional district are alive.
| Representative | Term of office | Date of birth (and age) |
|---|---|---|
| John Culver | 1965–1975 | August 8, 1932 |
| Mike Blouin | 1975–1979 | November 7, 1945 |
| Tom Tauke | 1979–1991 | October 11, 1950 |
| Jim Nussle | 1991–2003 | June 27, 1960 |
| Jim Leach | 2003–2007 | October 15, 1942 |
Historical district boundaries

See also
References
- 1 2 Washington Post page on the 2nd District of Iowa
- ↑ "Partisan Voting Index Districts of the 113th Congress: 2004 & 2008" (PDF). The Cook Political Report. 2012. Retrieved 2013-01-10.
- ↑ "2001 Iowa Redistricting Plan,". 2001.
- ↑ "Election Statistics,". 2005.
- Martis, Kenneth C. (1989). The Historical Atlas of Political Parties in the United States Congress. New York: Macmillan Publishing Company.
- Martis, Kenneth C. (1982). The Historical Atlas of United States Congressional Districts. New York: Macmillan Publishing Company.
- Congressional Biographical Directory of the United States 1774–present
Coordinates: 41°12′31″N 92°08′57″W / 41.20861°N 92.14917°W
This article is issued from Wikipedia - version of the 5/16/2016. The text is available under the Creative Commons Attribution/Share Alike but additional terms may apply for the media files.