Intraclass correlation

In statistics, the intraclass correlation (or the intraclass correlation coefficient, abbreviated ICC)[1] is an inferential statistic that can be used when quantitative measurements are made on units that are organized into groups. It describes how strongly units in the same group resemble each other. While it is viewed as a type of correlation, unlike most other correlation measures it operates on data structured as groups, rather than data structured as paired observations.
The intraclass correlation is commonly used to quantify the degree to which individuals with a fixed degree of relatedness (e.g. full siblings) resemble each other in terms of a quantitative trait (see heritability). Another prominent application is the assessment of consistency or reproducibility of quantitative measurements made by different observers measuring the same quantity.
Early ICC definition: unbiased but complex formula
The earliest work on intraclass correlations focused on the case of paired measurements, and the first intraclass correlation (ICC) statistics to be proposed were modifications of the interclass correlation (Pearson correlation).
Consider a data set consisting of N paired data values (xn,1, xn,2), for n = 1, ..., N. The intraclass correlation r originally proposed[2] by Ronald Fisher[3] is
- ,

where
- ,
- .


Later versions of this statistic [3] used the degrees of freedom 2N −1 in the denominator for calculating s2 and N −1 in the denominator for calculating r, so that s2 becomes unbiased, and r becomes unbiased if s is known.
The key difference between this ICC and the interclass (Pearson) correlation is that the data are pooled to estimate the mean and variance. The reason for this is that in the setting where an intraclass correlation is desired, the pairs are considered to be unordered. For example, if we are studying the resemblance of twins, there is usually no meaningful way to order the values for the two individuals within a twin pair. Like the interclass correlation, the intraclass correlation for paired data will be confined to the interval [-1, +1].
The intraclass correlation is also defined for data sets with groups having more than 2 values. For groups consisting of 3 values, it is defined as[3]
- ,

where
- ,
- .


As the number of values per groups grows, the number of cross-product terms in this expression grows rapidly. The equivalent form

where K is the number of data values per group, and is the sample mean of the nth group, is simpler to calculate.[3] This form is usually attributed to Harris.[4] The left term is non-negative, consequently the intraclass correlation must satisfy

- .

For large K, this ICC is nearly equal to

which can be interpreted as the fraction of the total variance that is due to variation between groups. Ronald Fisher devotes an entire chapter to Intraclass correlation in his classic book Statistical Methods for Research Workers.[3]
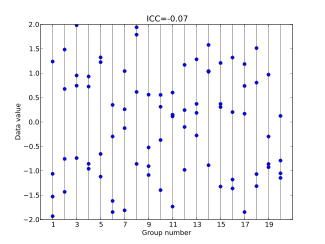
For data from a population that is completely noise, Fisher's formula produces ICC values that are distributed about 0, i.e. sometimes being negative. This is because Fisher designed the formula to be unbiased, and therefore its estimates are sometimes overestimates and sometimes underestimates. For small or 0 underlying values in the population, the ICC calculated from a sample may be negative.
Modern ICC definitions: simpler formula but positive bias
Beginning with Ronald Fisher, the intraclass correlation has been regarded within the framework of analysis of variance (ANOVA), and more recently in the framework of random effects models. A number of ICC estimators have been proposed. Most of the estimators can be defined in terms of the random effects model

where Yij is the ith observation in the jth group, μ is an unobserved overall mean, αj is an unobserved random effect shared by all values in group j, and εij is an unobserved noise term.[5] For the model to be identified, the αj and εij are assumed to have expected value zero and to be uncorrelated with each other. Also, the αj are assumed to be identically distributed, and the εij are assumed to be identically distributed. The variance of αj is denoted σα2 and the variance of εij is denoted σε2.
The population ICC in this framework is

An advantage of this ANOVA framework is that different groups can have different numbers of data values, which is difficult to handle using the earlier ICC statistics. Note also that this ICC is always non-negative, allowing it to be interpreted as the proportion of total variance that is "between groups." This ICC can be generalized to allow for covariate effects, in which case the ICC is interpreted as capturing the within-class similarity of the covariate-adjusted data values.[6]
This expression can never be negative (unlike Fisher's original formula) and therefore, in samples from a population which has an ICC of 0, the ICCs in the samples will be higher than the ICC of the population.
A number of different ICC statistics have been proposed, not all of which estimate the same population parameter. There has been considerable debate about which ICC statistics are appropriate for a given use, since they may produce markedly different results for the same data.[7][8]
Relationship to Pearson's correlation coefficient
In terms of its algebraic form, Fisher's original ICC is the ICC that most resembles the Pearson correlation coefficient. One key difference between the two statistics is that in the ICC, the data are centered and scaled using a pooled mean and standard deviation, whereas in the Pearson correlation, each variable is centered and scaled by its own mean and standard deviation. This pooled scaling for the ICC makes sense because all measurements are of the same quantity (albeit on units in different groups). For example, in a paired data set where each "pair" is a single measurement made for each of two units (e.g., weighing each twin in a pair of identical twins) rather than two different measurements for a single unit (e.g., measuring height and weight for each individual), the ICC is a more natural measure of association than Pearson's correlation.
An important property of the Pearson correlation is that it is invariant to application of separate linear transformations to the two variables being compared. Thus, if we are correlating X and Y, where, say, Y = 2X + 1, the Pearson correlation between X and Y is 1 — a perfect correlation. This property does not make sense for the ICC, since there is no basis for deciding which transformation is applied to each value in a group. However, if all the data in all groups are subjected to the same linear transformation, the ICC does not change.
Use in assessing conformity among observers
The ICC is used to assess the consistency, or conformity, of measurements made by multiple observers measuring the same quantity.[9] For example, if several physicians are asked to score the results of a CT scan for signs of cancer progression, we can ask how consistent the scores are to each other. If the truth is known (for example, if the CT scans were on patients who subsequently underwent exploratory surgery), then the focus would generally be on how well the physicians' scores matched the truth. If the truth is not known, we can only consider the similarity among the scores. An important aspect of this problem is that there is both inter-observer and intra-observer variability. Inter-observer variability refers to systematic differences among the observers — for example, one physician may consistently score patients at a higher risk level than other physicians. Intra-observer variability refers to deviations of a particular observer's score on a particular patient that are not part of a systematic difference.
The ICC is constructed to be applied to exchangeable measurements — that is, grouped data in which there is no meaningful way to order the measurements within a group. In assessing conformity among observers, if the same observers rate each element being studied, then systematic differences among observers are likely to exist, which conflicts with the notion of exchangeability. If the ICC is used in a situation where systematic differences exist, the result is a composite measure of intra-observer and inter-observer variability. One situation where exchangeability might reasonably be presumed to hold would be where a specimen to be scored, say a blood specimen, is divided into multiple aliquots, and the aliquots are measured separately on the same instrument. In this case, exchangeability would hold as long as no effect due to the sequence of running the samples was present.
Since the intraclass correlation coefficient gives a composite of intra-observer and inter-observer variability, its results are sometimes considered difficult to interpret when the observers are not exchangeable. Alternative measures such as Cohen's kappa statistic, the Fleiss kappa, and the concordance correlation coefficient[10] have been proposed as more suitable measures of agreement among non-exchangeable observers.
Calculation in software packages

ICC is supported in the open source software package R (using the function "icc" with the packages psy or irr, or via the function "ICC" in the package psych.) Commercial software also supports ICC, for instance Stata or SPSS [11]
Interpretation
Cicchetti (1994)[12] gives the following often quoted guidelines for interpretation for kappa or ICC inter-rater agreement measures:
- Less than 0.40—poor.
- Between 0.40 and 0.59—Fair.
- Between 0.60 and 0.74—Good.
- Between 0.75 and 1.00—Excellent.
See also
References
- ↑ Koch, Gary G. (1982). "Intraclass correlation coefficient". In Samuel Kotz and Norman L. Johnson. Encyclopedia of Statistical Sciences. 4. New York: John Wiley & Sons. pp. 213–217.
- ↑ Bartko, John J. (1966-08-01). "The Intraclass Correlation Coefficient as a Measure of Reliability". Psychological Reports. 19 (1): 3–11. doi:10.2466/pr0.1966.19.1.3. ISSN 0033-2941. PMID 5942109.
- 1 2 3 4 5 Ronald A. Fisher (1954). Statistical Methods for Research Workers (Twelfth ed.). Edinburgh: Oliver and Boyd. ISBN 0-05-002170-2.
- ↑ J. Arthur Harris (October 1913). "On the Calculation of Intra-Class and Inter-Class Coefficients of Correlation from Class Moments when the Number of Possible Combinations is Large". Biometrika. Biometrika Trust. 9 (3/4): 446–472. doi:10.1093/biomet/9.3-4.446. JSTOR 2331901.
- ↑ Donner, Allan; Koval, John J (1980). "The Estimation of Intraclass Correlation in the Analysis of Family Data". Biometrics. International Biometric Society. 36 (1): 19–25. doi:10.2307/2530491. JSTOR 2530491. PMID 7370372.
- ↑ Stanish, William; Taylor, Noel (1983). "Estimation of the Intraclass Correlation Coefficient for the Analysis of Covariance Model". The American Statistician. American Statistical Association. 37 (3): 221–224. doi:10.2307/2683375. JSTOR 2683375.
- ↑ Reinhold Müller & Petra Büttner (December 1994). "A critical discussion of intraclass correlation coefficients". Statistics in Medicine. 13 (23-24): 2465–2476. doi:10.1002/sim.4780132310. PMID 7701147. See also comment:
- P. Vargha (1997). "Letter to the Editor". Statistics in Medicine. 16 (7): 821–823. doi:10.1002/(SICI)1097-0258(19970415)16:7<821::AID-SIM558>3.0.CO;2-B.
- ↑ Kenneth O. McGraw & S. P. Wong (1996). "Forming inferences about some intraclass correlation coefficients" (PDF). Psychological Methods. 1: 30–46. doi:10.1037/1082-989X.1.1.30. There are several errors in the article:
- Kenneth O. McGraw & S. P. Wong (1996). "Correction to McGraw and Wong (1996)". Psychological Methods. 1: 390. doi:10.1037/1082-989x.1.4.390.
- ↑ P. E. Shrout & Joseph L. Fleiss (1979). "Intraclass Correlations: Uses in Assessing Rater Reliability". Psychological Bulletin. 86 (2): 420–428. doi:10.1037/0033-2909.86.2.420. PMID 18839484.
- ↑ Carol A. E. Nickerson (December 1997). "A Note on 'A Concordance Correlation Coefficient to Evaluate Reproducibility'". Biometrics. International Biometric Society. 53 (4): 1503–1507. doi:10.2307/2533516. JSTOR 2533516.
- ↑ Richard N. MacLennan (November 1993). "Interrater Reliability with SPSS for Windows 5.0". The American Statistician. American Statistical Association. 47 (4): 292–296. doi:10.2307/2685289. JSTOR 2685289.
- ↑ Cicchetti, Domenic V. "Guidelines, criteria, and rules of thumb for evaluating normed and standardized assessment instruments in psychology.". Psychological Assessment. 6 (4): 284–290. doi:10.1037/1040-3590.6.4.284.