Infrared atmospheric sounding interferometer
The infrared atmospheric sounding interferometer (IASI) is a Fourier transform spectrometer based on the Michelson interferometer, associated with an integrated imaging system (IIS).[1]
As part of the payload of the MetOp series of polar-orbiting meteorological satellites, there are currently two IASI instruments in operation: on MetOp-A (launched 19 October 2006) and on Met-Op B (launched 17 September 2012) with the third due for launch in 2017.[2]
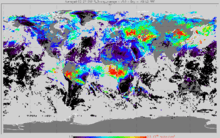
IASI is a nadir-viewing instrument recording infrared emission spectra from 645 to 2760 cm−1 at 0.25 cm−1 resolution (0.5 cm−1 after apodisation). Although primarily intended to provide information in near real-time on atmospheric temperature and water vapour to support weather forecasting, the concentrations of various trace gases can also be retrieved from the spectra.
Origin and development
IASI belongs to the thermal infrared (TIR) class of spaceborne instruments, which are devoted to tropospheric remote sensing. On the operational side, it is intended as a replacement for the HIRS instruments, whereas on the scientific side, it continues the mission of instruments dedicated to atmospheric composition, which are also nadir viewing, Fourier Transform instruments (e.g. Atmospheric Chemistry Experiment). Thus, it blends the demands imposed by both meteorology - high spatial coverage, and atmospheric chemistry - accuracy and vertical information for trace gases.[3] Designed by the Centre national d'Études Spatiales, it now combines a good horizontal coverage and a moderate spectral resolution.[3] Additionally, its counterpart on the Suomi NPP is the Cross-track infrared Sounder (CRiS).
Under an agreement between CNES and EUMETSAT (European Organisation for the Exploitation of Meteorological Satellites), the former was responsible for developing the instrument and data processing software. The latter is responsible for archiving and distributing the data to the users, as well as for operating IASI itself.[4][5] Currently, Alcatel Space is the prime contractor of the project and oversees the production of the recurring models.[5]
Main characteristics
Spectral range
The IASI spectral range has been chosen such that the instrument can record data from the following ranges:[3]
- carbon dioxide strong absorption around 15 μm
- ozone absorption ν2 around 9.6 μm
- water vapour ν3 strong absorption
- methane absorption up to the edge of TIR
As such, the spectral range of IASI is 645 – 2760 cm−1 (15.5 - 3.62 μm). It has 8461 spectral samples that are aligned in 3 bands within the spectral range, shown in the table below. Correspondingly, the spectral resolution at which the measurements are made is 0.5 cm−1.[3][6]
| Band | Wavenumbers (cm−1) | Wavelength (μm) |
|---|---|---|
| 1 | 645.0 - 1210.0 | 8.26 - 15.50 |
| 2 | 1210.0 - 2000.0 | 5.00 - 8.26 |
| 3 | 2000.0 - 2760.0 | 3.62 - 5.00 |
Each band has a specific purpose, as shown in the following table:[5]
| Band | Name of region | Spectral region (cm−1) | Absorption band | Usage |
|---|---|---|---|---|
| B1 | R1 | 650 - 770 | CO2 | Temperature profile |
| B1 | R2 | 790 - 980 | Atmospheric window | Surface and Cloud properties |
| B1 | R3 | 1000 - 1070 | O3 | O3 sounding |
| B1 | R4 | 1080 - 1150 | Atmospheric window | Surface and Cloud properties |
| B2 | R5 | 1210 - 1650 | H2O | Humidity profiles; CH4 and N2O properties |
| B3 | R6 | 2100 - 2150 | CO | CO column amount |
| B3 | R7 | 2150 - 2250 | N2O and CO2 | Temperature profile; N2O column amount |
| B3 | R8 | 2350 - 2420 | CO2 | Temperature profile |
| B3 | R9 | 2420 - 2700 | Atmospheric window | Surface and cloud properties |
| B3 | R10 | 2700 - 2760 | CH4 | CH4 column amount |
Sampling parameters
As an across track scanning system, IASI has a scan range of 48°20′ on either side of the nadir direction; the corresponding swath is then around 2×1100 km. Here, with respect to the flight direction of MetOp, the scanning executed by IASI starts on the left.
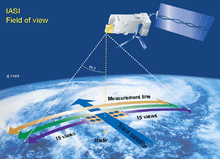
Also, a nominal scan line has three targets it must cover. First, a scan of the Earth where, within each step, there are 30 (15 in each 48°20′ branch) positions at which measurements are made. In addition to that, two views dedicated to calibration - henceforth, they will be referred to as reference views. One of the two is directed into deep space (cold reference), while the other is observing the internal black body (hot reference).[1]
The elementary (or effective) field of view (EFOV) is defined as the useful field of view at each scan position. Each such element consists of a 2×2 circular pixel matrix of what is called instantaneous fields of view (IFOV). Each of the four pixels projected on the ground is circular and has a diameter of 12 km at nadir.[1] The shape of the IFOV at the edge of the scan line is no longer circular: across track, it measures 39 km and along track, 20 km.[6]
Lastly, the IIS field of view is a square area, the side of which has an angular width of 59.63 mrad. Within this area, there are 64×64 pixels and they measure the same area as the EFOV above.[1]
Data processing system
The IASI instrument produces around 1 300 000 spectra every day. It takes around 8 seconds for IASI to acquire data from one complete across track and the onboard calibration. The former consists of 120 interferograms, each one corresponding to one pixel.[3] Of course, as researchers are really interested in the spectra, the data gathered by IASI has to pass through several stages of processing.[7]
Furthermore, IASI has an allocated data transmission rate of 1.5 Megabits (Mb) per second. However, the data production rate is 45 Mbit/s and therefore, a major part of the data processing is set to be on board. As such, the transmitted data is an encoded spectrum that is band merged and roughly calibrated.[7]
Additionally, there is an offline processing chain located at the Technical Expertise Centre, also referred to as TEC. Its task is to monitor the instrument performance, to compute the level 0 and 1 initialisation parameters in relation to the preceding point and to compute the long-term varying IASI products, as well as to monitor the Near Real Time (NTR) processing (i.e. levels 0 and 1).[7]
IASI processing levels
There are three such processing levels for the IASI data, numbered from 0 to 2. First, Level 0 data gives the raw output of the detectors, which Level 1 transforms into spectra by applying FFT and the necessary calibrations, and finally, Level 2 executes retrieval techniques so as to describe the physical state of the atmosphere that was observed.
The first two levels are dedicated to transforming the interferograms into spectra that are fully calibrated and independent of the state of the instrument at any given time. By contrast, the third is dedicated to the retrieval of meaningful parameters not only from IASI, but from other instruments from MetOp as well.[7]
For example, since the instrument is expected to be linear in energy, a non linearity correction is applied to the interferograms before the computation of the spectra. Next, the two reference views are used for the first step of radiometric calibration. A second step, performed on ground, is used to compensate for certain physical effects that have been ignored in the first (e.g., incidence correction for the scanning mirror, non-blackness effect etc.).[7]
A digital processing subsystem executes a radiometric calibration and an inverse Fourier transform in order to obtain the raw spectra.[7]
Level 0
The central objective of the Level 0 processing is to reduce the transmission rate by calibrating the spectra in terms of radiometry and merging the spectral bands. This is divided into three processing sub-chains:[7]
- Interferogram preprocessing that is concerned with:
- the non-linearity correction
- spike detection that prevents the use of corrupted interferograms during calibration
- the computation of NZPD (Number sampler of the Zero Path Difference) which determines the pivot sample corresponding to the Fourier Transform
- the algorithm that applies a Fourier Transform to the interferogram to give the spectrum corresponding to the measured interferogram.
- The computation of the radiometric coefficients and filtering
- The computation of atmospheric spectra involving applying the calibration coefficients, merging the bands and coding the spectra.
- by applying a spectral scaling law, removing the offset and applying a bit mask to the merged spectra, the transmission is done at an average rate of 8.2 bits per spectral sample, without losing useful information
Level 1
Level 1 is divided into three sublevels. Its main aim is to give the best estimate of the geometry of the interferometer at the time of the measurement. Several of the parameters of the estimation model are computing by the TEC processing chain and serve as input for the Level 1 estimations.[7]
The estimation model is used as a basis to compute a more accurate model by calculating the corresponding spectral calibration and apodisation functions. This allows the removal of all spectral variability of the measurements.[7]
Level 1a
- The estimation model is used here to give the correct spectral positions of the spectra samples, since the positions are varying from one pixel to another. Moreover, certain errors ignored in Level 0 are now accounted for, such as the emissivity of the black body not being unity or the dependency of the scanning mirror on temperature.[7]
- Also, it estimates the geolocation of IASI using the results from the correlation of AVHRR and the calibrated IIS image.[6]
Level 1b
- Here, the spectra are resampled. To perform this operation, the spectra from Level 1a are over-sampled by a factor of 5. These over-sampled spectra are finally interpolated on a new constant wave-number basis (0.25 cm−1),[7] by using a cubic spline interpolation.[6]
Level 1c
- The estimated apodisation functions are applied.[7]
- It generates the radiance cluster analysis based on AVHRR within the IASI IFOV using the IASI point spread function.[6]
Level 2
This level is concerned with deriving geophysical parameters from the radiance measurements:[1]
- Temperature profiles
- Humidity profiles
- Columnar ozone amounts in thick layers
- Surface temperature
- Surface emissivity
- Fractional cloud cover
- Cloud top temperature
- Cloud top pressure
- Cloud phase
- Total column of N2O
- Total column of CO
- Total column of CH4
- Total column of CO2
- Error covariance
- Processing and equality flags
The processes here are performed synergically with the ATOVS instrument suite, AVHRR and forecast data from numerical weather prediction.[1]
Methods of research
Some researchers prefer to use their own retrieval algorithms, which process Level 1 data, while others use directly the IASI Level 2 data. Multiple algorithms exist to produce Level 2 data, which differ in their assumptions and formulation and will therefore have different strengths and weaknesses (which can be investigated by intercomparison studies). The choice of algorithm is guided by knowledge of these limitations, the resources available and the specific features of the atmosphere that wish to be investigated.
In general, algorithms are based on the optimal estimation method. This essentially involves comparing the measured spectra with an a priori spectrum. Subsequently, the a priori model is contaminated with a certain amount of the item one wants to measure (e.g. SO2) and the resulting spectra are once again compared to the measured ones. The process is repeated again and again, the aim being to adjust the amount of contaminants such that simulated spectrum resembles the measured one as closely as possible. It must be noted that a variety of errors must be taken into consideration while perturbing the a priori, such as the error on the a priori, the instrumental error or the expected error.[8]
Alternatively, the IASI Level 1 data can be processed by least square fit algorithms. Again, the expected error must be taken into consideration.
Design
IASI's main structure comprises 6 sandwich panels that have an aluminium honeycomb core and carbon cyanate skins. Out of these, the one that supports optical sub-assemblies, electronics and mechanisms is called the main panel.[1][9]

The instrument's thermal architecture was engineered to split IASI in independent enclosures, optimising the design of every such enclosure in particular. For example, the optical components can be found in a closed volume containing only low dissipative elements, while the cube corners are exterior to this volume. Furthermore, the enclosure which contains the interferometer is almost entirely decoupled from the rest of the instrument by Multi-Layer Insulation (MLI). This determines a very good thermal stability for the optics of the interferometer: the temporal and spatial gradients are less than 1 °C, which is important for the radiometric calibration performance. Furthermore, other equipments are either sealed in specific enclosures, such as dissipative electronics or LASER sources, or thermally controlled through the thermal control section of the main structure, for example the scan mechanisms or the blackbody.[9]
Upon entering the interferometer, the light will encounter the following instruments:[5]
- Scan mirror which provides the ±48.3° swath symmetrically about the nadir. Moreover, it views the calibration hot and cold blackbody (internal blackbody and the deep space, respectively). For the step-by-step scene scanning, fluid lubricated bearings are used.
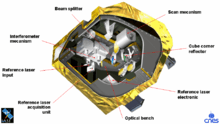
- Off-axis afocal telescope which transfers the aperture stop onto the scan mirror.
- Michelson Interferometer that has the general structure of the Michelson Interferometer, but two silicon carbide cube corner mirrors. The advantage of using corner reflectors over plane mirrors is that the latter would impose dynamic alignment.[4]
- Folding and off-axis focusing mirrors of which the first directs the recombined beam onto the latter. This results in an image of the Earth forming at the entrance of the cold box.
- The cold box which contains: aperture stops, field stops, field lens that images the aperture stop on the cube corners, dichroic plates dividing the whole spectrum range into the three spectral bands, lenses which produce an image of the field stop onto the detection unit, three focal planes that are equipped with micro lenses. These have the role to image the aperture stop on the detectors and preamplifiers.
So as to reduce the instrument background and thermo-elerctronic detector noise, the temperature of the cold box is maintained at 93 K by a passive cryogenic cooler.[9] This was preferred to a cryogenic machine due to the fact that the vibration levels of the latter can potential cause the degradation of the spectral quality.[4][5]
Measures against ice contamination
Ice accumulation on the optical surfaces determines loss of transmission. In order to reduce IASI's sensitivity to ice contamination, the emissive cavities have been added with two even holes.
Moreover, it was necessary to ensure protection for the cold optics from residual contamination. To achieve this, sealing improvements have been made (bellows and joints).
Suggested images
IASI at the European Space Agency
External links
- IASI at Centre national d'études spatiales
- IASI scanning the Earth
- IASI at TACT, LATMOS
- IASI at EODG, University of Oxford
References
- 1 2 3 4 5 6 7 "4. IASI Level 2 Products Overview". http://oiswww.eumetsat.org. Retrieved 9 July 2014. External link in
|website=(help) - ↑ Allen, Bob. "Metop is a series of three polar orbiting meteorological satellites which form the space segment component of the overall EUMETSAT Polar System (EPS).". EUMETSAT. EUMETSAT. Retrieved 24 July 2014.
- 1 2 3 4 5 Clerbaux, C.; Boynard, A.; Clarisse, L.; George, M.; Hadji-Lazaro, J.; Herbin, H.; Hurtmans, D.; Pommier, M.; Razavi, A.; Turquety, S.; Wespes, C.; Coheur, P.-F. (2009). "Monitoring of atmospheric composition using the thermal infrared IASI/MetOp sounder" (pdf, xml). Atmospheric Chemistry and Physics. 9 (16): 6041–6054. doi:10.5194/acp-9-6041-2009.
- 1 2 3 Hébert, Ph.; Blumstein, D.; Buil, C.; Carlier, T.; Chalon, G.; Astruc, P.; Clauss, A.; Siméoni, D.; Tournier, B. (2004). "IASI instrument: technical description and measured performances". Proceedings of the 5th International Conference on Space Optics. 554: 49–56.
- 1 2 3 4 5 Blumstein, D.; Chalon, G.; Carlier, T.; Buil, C.; Hébert, Ph.; Maciaszek, T.; Ponce, G.; Phulpin, T.; Tournier, B.; Siméoni, D.; Astruc, P.; Clauss, A.; Kayal, G.; Jegou, R. (2004). "IASI instrument: technical overview and measured performances". Proceedings of the SPIE. Infrared Spaceborne Remote Sensing XII. 5543: 196–207. doi:10.1117/12.560907.
- 1 2 3 4 5 "4. IASI Level 1 Products Overview". http://oiswww.eumetsat.org. Retrieved 9 July 2014. External link in
|website=(help) - 1 2 3 4 5 6 7 8 9 10 11 12 Tournier, Bernard; Blumstein, Denis; Cayla, Françoi-Régis. "IASI Level 0 and 1 processing algorithms description". Retrieved 14 July 2014.
- ↑ "IASI". http://www2.physics.ox.ac.uk/. Retrieved 22 July 2014. External link in
|website=(help) - 1 2 3 Siméoni, D.; Astruc, P.; Miras, D.; Alis, C.; Andreis, O.; Scheidel, D.; Degrelle, C.; Nicol, P.; Bailly, B.; Guiard, P.; Clauss, A.; Blumstein, D.; Maciaszek, T.; Chalon, G.; Carlier, T.; Kayal, G. (2004). "Design and development of IASI instrument" (pdf). Proc. SPIE. Infrared Spaceborne Remote Sensing XII. 5543: 208–219. doi:10.1117/12.561090.