Hydrographic survey


Hydrographic survey is the science of measurement and description of features which affect maritime navigation, marine construction, dredging, offshore oil exploration/offshore oil drilling and related activities. Strong emphasis is placed on soundings, shorelines, tides, currents, seabed and submerged obstructions that relate to the previously mentioned activities. The term hydrography is l used synonymously to describe maritime cartography, which in the final stages of the hydrographic process uses the raw data collected through hydrographic survey into information usable by the end user.
Hydrography is collected under rules which vary depending on the acceptance authority. Traditionally conducted by ships with a sounding line or echo sounding, surveys are increasingly conducted with the aid of aircraft and sophisticated electronic sensor systems in shallow waters.
Organizations
National and International Maritime Hydrography
Hydrographic offices evolved from naval heritage and are usually found within national naval structures, for example Spain's Instituto Hidrográfico de la Marina.[1] Coordination of those organizations and product standardization is voluntarily joined with the goal of improving hydrography and safe navigation is conducted by the International Hydrographic Organization (IHO). The IHO publishes Standards and Specifications[2] followed by its Member States as well as Memoranda of Understanding and Co-operative Agreements[3] with hydrographic survey interests.
The product of such hydrography is most often seen on nautical charts published by the national agencies and required by the International Maritime Organization (IMO),[4] the Safety of Life at Sea (SOLAS)[5] and national regulations to be carried on vessels for safety purposes. Increasingly those charts are provided and used in electronic form unders IHO standards.
Hydrographic survey conducted by non-national agencies
Governmental entities below the national level conduct or contract for hydrographic surveys for waters within their jurisdictions with both internal and contract assets. Such surveys commonly are conducted by national organizations or under their supervision or the standards they have approved, particularly when the use is for the purposes of chart making and distribution or the dredging of state-controlled waters.
In the United States, there is coordination with the National Hydrography Dataset in survey collection and publication.[6] State environmental organizations publish hydrographic data relating to their mission.[7]
Hydrographic survey by private organizations
Commercial entities also conduct large-scale hydrographic and geophysical surveying, particularly in the dredging, marine construction, oil exploration, and drilling industries. Industrial entities installing submarine communications cables[8] or power[9] require detailed surveys of cable routes prior to installation and increasingly use acoustic imagery equipment previously found only in military applications when conducting their surveys.[10] Specialized companies exist that haveboth the equipment and expertise to contract with both commercial and governmental entities to perform such surveys .
Companies, universities, and investment groups will often fund hydrographic surveys of public waterways prior to developing areas adjacent those waterways. Survey firms are also contracted to survey in support of design and engineering firms that are under contract for large public projects.[11] Private surveys are also conducted before dredging operations and after these operations are completed. Companies with large private slips, docks, or other waterfront installations have their facilities and the open water near their facilities surveyed regularly, as do islands in areas subject to variable erosion such as in the Maldives.
Hydrographic survey by crowdsourcing
Crowdsourcing also is entering hydrographic surveying, with projects such as OpenSeaMap,[12] TeamSurv and ARGUS. Here, volunteer vessels record position, depth, and time data using their standard navigation instruments, and then the data is post-processed to account for speed of sound, tidal, and other corrections. With this approach there is no need for a specific survey vessel, or for professionally qualified surveyors to be on board, as the expertise is in the data processing that occurs once the data is uploaded to the server after the voyage. Apart from obvious cost savings, this also gives a continuous survey of an area, but the drawbacks are time in recruiting observers and getting a high enough density and quality of data. Although sometimes accurate to 0.1 - 0.2m, this approach cannot substitute for a rigorous systematic survey, where this is required. Nevertheless, the results are often more than adequate for many requirements where high resolution, high accuracy surveys are not required or are unaffordable.
Methods
Lead lines, sounding poles, and single-beam echosounders
The history of hydrographic surveying dates almost as far back as that of sailing.[13] For many centuries, a hydrographic survey required the use of lead lines – ropes or lines with depth markings attached to lead weights to make one end sink to the bottom when lowered over the side of a ship or boat – and sounding poles, which were poles with depth markings which could be thrust over the side until they touched bottom. In either case, the depths measured had to be read manually and recorded, as did the position of each measurement with regard to mapped reference points as determined by three-point sextant fixes. The process was labor-intensive and time-consuming and, although each individual depth measurement could be accurate, even a thorough survey as a practical matter could include only a limited number of sounding measurements relative to the area being surveyed, inevitably leaving gaps in coverage between single soundings.[13]
Single-beam echosounders and fathometers began to enter service in the 1930s which used sonar to measure the depth beneath a vessel. This greatly increased the speed of acquiring sounding data over that possible with lead lines and sounding poles by allowing information on depths beneath a vessel to be gathered in a series of lines spaced at a specified distance. However, it shared the weakness of earlier methods by lacking depth information for areas in between the strips of sea bottom the vessel sounded.[13]
Wire-drag surveying

In 1904, wire-drag surveys were introduced into hydrography, and the U.S. Coast and Geodetic Survey's Nicholas H. Heck played a prominent role in developing and perfecting the technique between 1906 and 1916.[14] In the wire-drag method, a wire attached to two ships or boats and set at a certain depth by a system of weights and buoys was dragged between two points. If the wire encountered an obstruction, it would become taut and form a "V" shape. The location of the "V" revealed the position of submerged rocks, wrecks, and other obstructions, while the depth at which the wire was set showed the depth at which the obstruction was encountered.[13] This method revolutionized hydrographic surveying, as it allowed a quicker, less laborious, and far more complete survey of an area than did the use of lead lines and sounding poles.
Prior to the advent of sidescan sonar, wire-drag surveying was the only method for searching large areas for obstructions and lost vessels and aircraft.[15] Between 1906 and 1916, Heck expanded the capability of wire-drag systems from a relatively limited area to sweeps covering channels two to three nautical miles (3.7 to 5.6 km) in width.[16] The wire-drag technique was a major contribution to hydrographic surveying during much of the rest of the 20th century. So valuable was wire-drag surveying in the United States that for decades the U.S. Coast and Geodetic Survey, and later the National Oceanic and Atmospheric Administration, fielded a pair of sister ships of identical design specifically to work together on such surveys. USC&GS Marindin and USC&GS Ogden conducted wire-drag surveys together from 1919 to 1942, USC&GS Hilgard (ASV 82) and USC&GS Wainwright (ASV 83) took over from 1942 to 1967, and USC&GS Rude (ASV 90) (later NOAAS Rude (S 590)) and USC&GS Heck (ASV 91) (later NOAAS Heck (S 591)) worked together on wire-drag operations from 1967.[13][17][18][19][20][21]
The rise of new electronic technologies – sidescan sonar and multibeam swath systems – in the 1950s, 1960s and 1970s eventually made the wire-drag system obsolete. Sidescan sonar could create images of underwater obstructions with the same fidelity as aerial photography, while multibeam systems could generate depth data for 100 percent of the bottom in a surveyed area. These technologies allowed a single vessel to do what wire-drag surveying required two vessels to do, and wire-drag surveys finally came to an end in the early 1990s.[13][16] Vessels were freed from working together on wire-drag surveys, and in NOAA, for example, Rude and Heck operated independently in their later years.[20][21]
Modern surveying
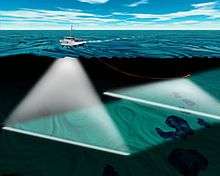
In suitable shallow-water areas lidar (light detection and ranging) may be used.[22] Equipment can be installed on inflatable craft, such as Zodiacs, small craft, autonomous underwater vehicles (AUVs), unmanned underwater vehicles (UUVs) or large ships, and can include sidescan, single-beam and multibeam equipment. At one time different data collection methods and standards were used in collecting hydrographic data for maritime safety and for scientific or engineering bathymetric charts, but increasingly, with the aid of improved collection techniques and computer processing, the data is collected under one standard and extracted for specific use.
After data is collected, it has to undergo post-processing. A massive amount of data is collected during the typical hydrographic survey, often several soundings per square foot. Depending on the final use intended for the data (for example, navigation charts, Digital Terrain Model, volume calculation for dredging, topography, or bathymetry) this data must be thinned out. It must also be corrected for errors (i.e., bad soundings,) and for the effects of tides, waves/heave, water level and thermoclines (water temperature differences). Usually the surveyor has additional data collection equipment on site to record the data required for correcting the soundings. The final output of charts can be created with a combination of specialty charting software or a computer-aided design (CAD) package, usually Autocad.
Although the accuracy of crowd-sourced surveying can rarely reach the standards of traditional methods, the algorithms used rely on a high data density to produce final results that are more accurate than single measurements. A comparison of crowd-sourced surveys with multibeam surveys indicates an accuracy of crowd-sourced surveys of around plus or minus 0.1 to 0.2 meter (about 4 to 8 inches).
See also
References
- ↑ http://www.armada.mde.es/ArmadaPortal/page/Portal/ArmadaEspannola/ciencia_ihm_1/ | Armada Esapñola - Instituto Hidrográfico de la Marina
- ↑ http://www.iho-ohi.net/english/standards-publications/introduction.html | IHO Catalogue of Publications
- ↑ http://www.iho-ohi.net/english/letters-and-documents/mou-agreements.html | IHO Memoranda of Understanding and Co-operative Agreements
- ↑ http://www.imo.org/safety/mainframe.asp?topic_id=350 | IMO
- ↑ http://www.icomia.com/technical-info/docs/SOLASV.pdf | SOLAS CHAPTER V SAFETY OF NAVIGATION
- ↑ http://www.dnr.state.wi.us/maps/gis/datahydro.html | Wisconsin DNR - Surface Water (Hydrography) Data - Conversion from Coverage to Geodatabase
- ↑ http://www.tceq.state.tx.us/implementation/water/tmdl/hydromaps.html | Texas Commission on Environmental Quality - Hydrography Maps and Data
- ↑ http://www.setech-uk.com/pdf/Paper2.pdf HYDROGRAPHIC INFORMATION AND THE SUBMARINE CABLE INDUSTRY
- ↑ http://sanpedrosun.net/old/belcable.html | BEL submarine cable survey complete
- ↑ http://www.hydro-international.com/news/id2826-Utec_Surveyor_Equipped_for_Deep_Ocean_Cable_Route_Surveys.html | Utec Surveyor Equipped for Deep Ocean Cable Route Surveys
- ↑ http://www.hydro-international.com/news/id3583-Infrastructure_Survey_in_Turkey.html | Infrastructure Survey in Turkey 14 December 2009
- ↑ Hydro International: Water Depths by Crowdsourcing
- 1 2 3 4 5 6 http://www.nauticalcharts.noaa.gov/hsd/hydro_history.html NOAA History: History of Hydrographic Surveying
- ↑ NOAA History: Profiles in Time: Nicholas Hunter Heck
- ↑ NOAA History: Coast and Geodetic Survey Ships: Heck
- 1 2 celebrating200years.noaa.gov NOAA 200th Top Tens: Breakthroughs: Hydrographic Survey Techniques: Wire-Drag Survey Technique, 2007
- ↑ NOAA History: Coast and Geodetic Survey Ships: Marindin
- ↑ NOAA History: Coast and Geodetic Survey Ships: Ogden
- ↑ History: Coast and Geodetic Survey Ships: Hilgard
- 1 2 History: Coast and Geodetic Survey Ships: Rude
- 1 2 NOAA History: Coast and Geodetic Survey Ships: Heck
- ↑ http://www.nauticalcharts.noaa.gov/hsd/docs/NHSP_2009_TextOnly.pdf | NOAA Hydrographic Survey Priorities 2009 Edition
External links
- International Hydrographic Organization
- IHO - Download / OHI - Téléchargement
- NGA - Products and Services Available to the Public
- United Kingdom Hydrographic Office
- Indian Naval Hydrographic Department
- Australian Hydrographic Service (AHS)
- Armada Esapñola - Instituto Hidrográfico de la Marina
- NOAA, Office of Coast Survey, Survey Data
- NOAA Marine Operations (Survey Fleet)
- Hydro International (Professional journal for hydrography with technical and industry news articles.)
- ACADEMY OF POSITIONING MARINE AND BATHYMETRY
NOAA maintains a massive database of survey results, charts, and data on the NOAA site.
- NOAA's Hydrographic Website
- NOS Data Explorer portal
- The Support for Hydrographer
- TeamSurv - Crowd sourced hydrographic surveying