Hauenstein-Ifenthal
| Hauenstein-Ifenthal | ||
|---|---|---|
|
Ifenthal village | ||
| ||
 Hauenstein-Ifenthal | ||
|
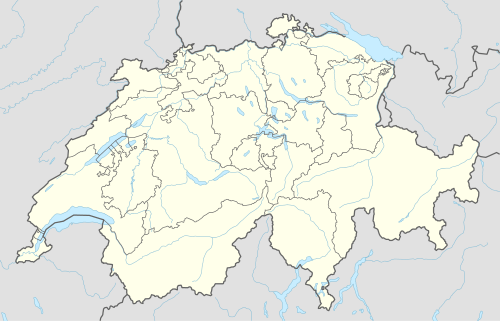
Location of Hauenstein-Ifenthal  | ||
| Coordinates: 47°23′N 7°52′E / 47.383°N 7.867°ECoordinates: 47°23′N 7°52′E / 47.383°N 7.867°E | ||
| Country | Switzerland | |
| Canton | Solothurn | |
| District | Gösgen | |
| Area[1] | ||
| • Total | 5.35 km2 (2.07 sq mi) | |
| Elevation | 675 m (2,215 ft) | |
| Population (Dec 2015[2]) | ||
| • Total | 314 | |
| • Density | 59/km2 (150/sq mi) | |
| Postal code | 4633 | |
| SFOS number | 2491 | |
| Surrounded by | Eptingen (BL), Hägendorf, Läufelfingen (BL), Rickenbach, Trimbach, Wangen bei Olten, Wisen | |
| Website |
www SFSO statistics | |


Hauenstein-Ifenthal is a municipality in the district of Gösgen in the canton of Solothurn in Switzerland.
History
Ifenthal is first mentioned in 1189 as Ifental. Hauenstein was mentioned in 1260 as Horwen.[3]
Geography

Hauenstein-Ifenthal has an area, as of 2009, of 5.35 square kilometers (2.07 sq mi). Of this area, 2.71 km2 (1.05 sq mi) or 50.7% is used for agricultural purposes, while 2.15 km2 (0.83 sq mi) or 40.2% is forested. Of the rest of the land, 0.43 km2 (0.17 sq mi) or 8.0% is settled (buildings or roads) and 0.02 km2 (4.9 acres) or 0.4% is unproductive land.[4]
Of the built up area, housing and buildings made up 3.0% and transportation infrastructure made up 2.4%. Power and water infrastructure as well as other special developed areas made up 1.7% of the area Out of the forested land, 38.7% of the total land area is heavily forested and 1.5% is covered with orchards or small clusters of trees. Of the agricultural land, 5.4% is used for growing crops and 39.8% is pastures, while 1.1% is used for orchards or vine crops and 4.3% is used for alpine pastures.[4]
The municipality is located in the Gösgen district. It consists of the villages of Hauenstein and Ifenthal as well as a number of scattered, individual houses. The municipalities of Hauenstein-Ifenthal, Trimbach, Wisen and Olten are considering a merger at a date in the future into the new municipality of with an, as of 2011, undetermined name.[5]
Coat of arms
The blazon of the municipal coat of arms is Gules a lion passant Or on a base Vert.[6]
Demographics
Hauenstein-Ifenthal has a population (as of December 2015) of 314.[7] As of 2008, 7.0% of the population are resident foreign nationals.[8] Over the last 10 years (1999–2009 ) the population has changed at a rate of 18.5%.[9]
Most of the population (as of 2000) speaks German (261 or 98.5%), with Romansh being second most common (3 or 1.1%) and Spanish being third (1 or 0.4%).[10]
As of 2008, the gender distribution of the population was 50.5% male and 49.5% female. The population was made up of 145 Swiss men (46.6% of the population) and 12 (3.9%) non-Swiss men. There were 144 Swiss women (46.3%) and 10 (3.2%) non-Swiss women.[11] Of the population in the municipality 99 or about 37.4% were born in Hauenstein-Ifenthal and lived there in 2000. There were 77 or 29.1% who were born in the same canton, while 69 or 26.0% were born somewhere else in Switzerland, and 10 or 3.8% were born outside of Switzerland.[10]
In 2008 there were 5 live births to Swiss citizens and were 2 deaths of Swiss citizens and 1 non-Swiss citizen death. Ignoring immigration and emigration, the population of Swiss citizens increased by 3 while the foreign population decreased by 1. There was 1 Swiss man and 4 Swiss women who immigrated back to Switzerland. At the same time, there was 1 non-Swiss man who immigrated from another country to Switzerland. The total Swiss population change in 2008 (from all sources, including moves across municipal borders) was an increase of 16 and the non-Swiss population increased by 2 people. This represents a population growth rate of 6.1%.[8]
The age distribution, as of 2000, in Hauenstein-Ifenthal is; 26 children or 9.8% of the population are between 0 and 6 years old and 54 teenagers or 20.4% are between 7 and 19. Of the adult population, 18 people or 6.8% of the population are between 20 and 24 years old. 72 people or 27.2% are between 25 and 44, and 63 people or 23.8% are between 45 and 64. The senior population distribution is 21 people or 7.9% of the population are between 65 and 79 years old and there are 11 people or 4.2% who are over 80.[12]
As of 2000, there were 130 people who were single and never married in the municipality. There were 110 married individuals, 13 widows or widowers and 12 individuals who are divorced.[10]
As of 2000, there were 95 private households in the municipality, and an average of 2.6 persons per household.[9] There were 27 households that consist of only one person and 12 households with five or more people. Out of a total of 97 households that answered this question, 27.8% were households made up of just one person and there were 2 adults who lived with their parents. Of the rest of the households, there are 27 married couples without children, 35 married couples with children There were 2 single parents with a child or children. There were 2 households that were made up of unrelated people and 2 households that were made up of some sort of institution or another collective housing.[10]
In 2000 there were 55 single-family homes (or 58.5% of the total) out of a total of 94 inhabited buildings. There were 11 multi-family buildings (11.7%), along with 23 multi-purpose buildings that were mostly used for housing (24.5%) and 5 other use buildings (commercial or industrial) that also had some housing (5.3%). Of the single-family homes 11 were built before 1919, while 10 were built between 1990 and 2000. The greatest number of single-family homes (12) were built between 1971 and 1980.[13]
In 2000 there were 114 apartments in the municipality. The most common apartment size was 4 rooms of which there were 32. There were single-room apartments and 55 apartments with five or more rooms. Of these apartments, a total of 89 apartments (78.1% of the total) were permanently occupied, while 16 apartments (14.0%) were seasonally occupied and 9 apartments (7.9%) were empty.[13] As of 2009, the construction rate of new housing units was 0 new units per 1000 residents.[9] The vacancy rate for the municipality, in 2010, was 0.77%.[9]
The historical population is given in the following chart:[3][14]

Politics
In the 2007 federal election the most popular party was the CVP which received 30.58% of the vote. The next three most popular parties were the SVP (20.9%), the Green Party (19.36%) and the FDP (16.65%). In the federal election, a total of 121 votes were cast, and the voter turnout was 59.3%.[15]
Economy
As of 2010, Hauenstein-Ifenthal had an unemployment rate of 1.1%. As of 2008, there were 40 people employed in the primary economic sector and about 15 businesses involved in this sector. 2 people were employed in the secondary sector and there were 2 businesses in this sector. 53 people were employed in the tertiary sector, with 10 businesses in this sector.[9] There were 138 residents of the municipality who were employed in some capacity, of which females made up 42.0% of the workforce.
In 2008 the total number of full-time equivalent jobs was 59. The number of jobs in the primary sector was 20, all of which were in agriculture. The number of jobs in the secondary sector was 2, all of which were in construction. The number of jobs in the tertiary sector was 37. In the tertiary sector; 1 was in the sale or repair of motor vehicles, 24 or 64.9% were in a hotel or restaurant, 1 was a technical professional or scientist, 9 or 24.3% were in education.[16]
In 2000, there were 21 workers who commuted into the municipality and 95 workers who commuted away. The municipality is a net exporter of workers, with about 4.5 workers leaving the municipality for every one entering.[17] Of the working population, 15.2% used public transportation to get to work, and 60.1% used a private car.[9]
Religion

From the 2000 census, 157 or 59.2% were Roman Catholic, while 61 or 23.0% belonged to the Swiss Reformed Church. Of the rest of the population, and there were 2 individuals (or about 0.75% of the population) who belonged to another Christian church. 33 (or about 12.45% of the population) belonged to no church, are agnostic or atheist, and 12 individuals (or about 4.53% of the population) did not answer the question.[10]
Education
In Hauenstein-Ifenthal about 110 or (41.5%) of the population have completed non-mandatory upper secondary education, and 32 or (12.1%) have completed additional higher education (either university or a Fachhochschule). Of the 32 who completed tertiary schooling, 68.8% were Swiss men, 25.0% were Swiss women.[10]
As of 2000, there were 29 students from Hauenstein-Ifenthal who attended schools outside the municipality.[17]
References
- ↑ Arealstatistik Standard - Gemeindedaten nach 4 Hauptbereichen
- ↑ Swiss Federal Statistical Office - STAT-TAB, online database – Ständige und nichtständige Wohnbevölkerung nach institutionellen Gliederungen, Geburtsort und Staatsangehörigkeit (German) accessed 30 August 2016
- 1 2 Hauenstein-Ifenthal in German, French and Italian in the online Historical Dictionary of Switzerland.
- 1 2 Swiss Federal Statistical Office-Land Use Statistics 2009 data (German) accessed 25 March 2010
- ↑ Amtliches Gemeindeverzeichnis der Schweiz published by the Swiss Federal Statistical Office (German) accessed 17 February 2011
- ↑ Flags of the World.com accessed 28-March-2011
- ↑ Swiss Federal Statistical Office - STAT-TAB, online database – Ständige und nichtständige Wohnbevölkerung nach institutionellen Gliederungen, Geburtsort und Staatsangehörigkeit (German) accessed 30 August 2016
- 1 2 Swiss Federal Statistical Office - Superweb database - Gemeinde Statistics 1981-2008 (German) accessed 19 June 2010
- 1 2 3 4 5 6 Swiss Federal Statistical Office accessed 28-March-2011
- 1 2 3 4 5 6 STAT-TAB Datenwürfel für Thema 40.3 - 2000 (German) accessed 2 February 2011
- ↑ Canton of Solothurn Statistics - Wohnbevölkerung der Gemeinden nach Nationalität und Geschlecht (German) accessed 11 March 2011
- ↑ Canton of Solothurn Statistics - Wohnbevölkerung nach Gemeinden, Nationalität, Altersgruppen und Zivilstand, Total (Männer + Frauen) (German) accessed 11 March 2011
- 1 2 Federal Statistical Office STAT-TAB - Datenwürfel für Thema 09.2 - Gebäude und Wohnungen (German) accessed 28 January 2011
- ↑ Swiss Federal Statistical Office STAT-TAB Bevölkerungsentwicklung nach Region, 1850-2000 (German) accessed 29 January 2011
- ↑ Swiss Federal Statistical Office, Nationalratswahlen 2007: Stärke der Parteien und Wahlbeteiligung, nach Gemeinden/Bezirk/Canton (German) accessed 28 May 2010
- ↑ Swiss Federal Statistical Office STAT-TAB Betriebszählung: Arbeitsstätten nach Gemeinde und NOGA 2008 (Abschnitte), Sektoren 1-3 (German) accessed 28 January 2011
- 1 2 Swiss Federal Statistical Office - Statweb (German) accessed 24 June 2010
External links
- Official website (German)
- Hauenstein-Ifenthal in German, French and Italian in the online Historical Dictionary of Switzerland.
| Wikimedia Commons has media related to Hauenstein-Ifenthal. |