Graph drawing
Graph drawing is an area of mathematics and computer science combining methods from geometric graph theory and information visualization to derive two-dimensional depictions of graphs arising from applications such as social network analysis, cartography, linguistics, and bioinformatics.[1]
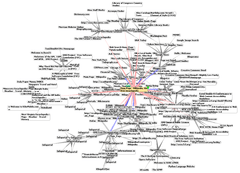
A drawing of a graph or network diagram is a pictorial representation of the vertices and edges of a graph. This drawing should not be confused with the graph itself: very different layouts can correspond to the same graph.[2] In the abstract, all that matters is which pairs of vertices are connected by edges. In the concrete, however, the arrangement of these vertices and edges within a drawing affects its understandability, usability, fabrication cost, and aesthetics.[3] The problem gets worse, if the graph changes over time by adding and deleting edges (dynamic graph drawing) and the goal is to preserve the user's mental map.[4]
Graphical conventions
Graphs are frequently drawn as node-link diagrams in which the vertices are represented as disks, boxes, or textual labels and the edges are represented as line segments, polylines, or curves in the Euclidean plane.[3] Node-link diagrams can be traced back to the 13th century work of Ramon Llull, who drew diagrams of this type for complete graphs in order to analyze all pairwise combinations among sets of metaphysical concepts.[5]
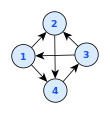
In the case of directed graphs, arrowheads form a commonly used graphical convention to show their orientation;[2] however, user studies have shown that other conventions such as tapering provide this information more effectively.[6] Upward planar drawing uses the convention that every edge is oriented from a lower vertex to a higher vertex, making arrowheads unnecessary.[7]
Alternative conventions to node-link diagrams include adjacency representations such as circle packings, in which vertices are represented by disjoint regions in the plane and edges are represented by adjacencies between regions; intersection representations in which vertices are represented by non-disjoint geometric objects and edges are represented by their intersections; visibility representations in which vertices are represented by regions in the plane and edges are represented by regions that have an unobstructed line of sight to each other; confluent drawings, in which edges are represented as smooth curves within mathematical train tracks; fabrics, in which nodes are represented as horizontal lines and edges as vertical lines;[8] and visualizations of the adjacency matrix of the graph.
Quality measures
Many different quality measures have been defined for graph drawings, in an attempt to find objective means of evaluating their aesthetics and usability.[9] In addition to guiding the choice between different layout methods for the same graph, some layout methods attempt to directly optimize these measures.

- The crossing number of a drawing is the number of pairs of edges that cross each other. If the graph is planar, then it is often convenient to draw it without any edge intersections; that is, in this case, a graph drawing represents a graph embedding. However, nonplanar graphs frequently arise in applications, so graph drawing algorithms must generally allow for edge crossings.[10]
- The area of a drawing is the size of its smallest bounding box, relative to the closest distance between any two vertices. Drawings with smaller area are generally preferable to those with larger area, because they allow the features of the drawing to be shown at greater size and therefore more legibly. The aspect ratio of the bounding box may also be important.
- Symmetry display is the problem of finding symmetry groups within a given graph, and finding a drawing that displays as much of the symmetry as possible. Some layout methods automatically lead to symmetric drawings; alternatively, some drawing methods start by finding symmetries in the input graph and using them to construct a drawing.[11]
- It is important that edges have shapes that are as simple as possible, to make it easier for the eye to follow them. In polyline drawings, the complexity of an edge may be measured by its number of bends, and many methods aim to provide drawings with few total bends or few bends per edge. Similarly for spline curves the complexity of an edge may be measured by the number of control points on the edge.
- Several commonly used quality measures concern lengths of edges: it is generally desirable to minimize the total length of the edges as well as the maximum length of any edge. Additionally, it may be preferable for the lengths of edges to be uniform rather than highly varied.
- Angular resolution is a measure of the sharpest angles in a graph drawing. If a graph has vertices with high degree then it necessarily will have small angular resolution, but the angular resolution can be bounded below by a function of the degree.[12]
- The slope number of a graph is the minimum number of distinct edge slopes needed in a drawing with straight line segment edges (allowing crossings). Cubic graphs have slope number at most four, but graphs of degree five may have unbounded slope number; it remains open whether the slope number of degree-4 graphs is bounded.[12]
Layout methods

There are many different graph layout strategies:
- In force-based layout systems, the graph drawing software modifies an initial vertex placement by continuously moving the vertices according to a system of forces based on physical metaphors related to systems of springs or molecular mechanics. Typically, these systems combine attractive forces between adjacent vertices with repulsive forces between all pairs of vertices, in order to seek a layout in which edge lengths are small while vertices are well-separated. These systems may perform gradient descent based minimization of an energy function, or they may translate the forces directly into velocities or accelerations for the moving vertices.[14]
- Spectral layout methods use as coordinates the eigenvectors of a matrix such as the Laplacian derived from the adjacency matrix of the graph.[15]
- Orthogonal layout methods, which allow the edges of the graph to run horizontally or vertically, parallel to the coordinate axes of the layout. These methods were originally designed for VLSI and PCB layout problems but they have also been adapted for graph drawing. They typically involve a multiphase approach in which an input graph is planarized by replacing crossing points by vertices, a topological embedding of the planarized graph is found, edge orientations are chosen to minimize bends, vertices are placed consistently with these orientations, and finally a layout compaction stage reduces the area of the drawing.[16]
- Tree layout algorithms these show a rooted tree-like formation, suitable for trees. Often, in a technique called "balloon layout", the children of each node in the tree are drawn on a circle surrounding the node, with the radii of these circles diminishing at lower levels in the tree so that these circles do not overlap.[17]
- Layered graph drawing methods (often called Sugiyama-style drawing) are best suited for directed acyclic graphs or graphs that are nearly acyclic, such as the graphs of dependencies between modules or functions in a software system. In these methods, the nodes of the graph are arranged into horizontal layers using methods such as the Coffman–Graham algorithm, in such a way that most edges go downwards from one layer to the next; after this step, the nodes within each layer are arranged in order to minimize crossings.[18]
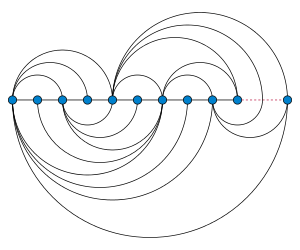
- Arc diagrams, a layout style dating back to the 1960s,[19] place vertices on a line; edges may be drawn as semicircles above or below the line, or as smooth curves linked together from multiple semicircles.
- Circular layout methods place the vertices of the graph on a circle, choosing carefully the ordering of the vertices around the circle to reduce crossings and place adjacent vertices close to each other. Edges may be drawn either as chords of the circle or as arcs inside or outside of the circle. In some cases, multiple circles may be used.[20]
- Dominance drawing places vertices in such a way that one vertex is upwards, rightwards, or both of another if and only if it is reachable from the other vertex. In this way, the layout style makes the reachability relation of the graph visually apparent.[21]
Application-specific graph drawings
Graphs and graph drawings arising in other areas of application include
- Sociograms, drawings of a social network, as often offered by social network analysis software[22]
- Hasse diagrams, a type of graph drawing specialized to partial orders[23]
- Dessin d'enfants, a type of graph drawing used in algebraic geometry[24]
- State diagrams, graphical representations of finite state machines[25]
- Computer network diagrams, depictions of the nodes and connections in a computer network[26]
- Flow charts, drawings in which the nodes represent the steps of an algorithm and the edges represent control flow between steps.
- Data flow diagrams, drawings in which the nodes represent the components of an information system and the edges represent the movement of information from one component to another.
- Bioinformatics including phylogenetic trees, protein-protein interaction networks, and metabolic pathways.[27]
In addition, the placement and routing steps of electronic design automation (EDA) are similar in many ways to graph drawing, as is the problem of greedy embedding in distributed computing, and the graph drawing literature includes several results borrowed from the EDA literature. However, these problems also differ in several important ways: for instance, in EDA, area minimization and signal length are more important than aesthetics, and the routing problem in EDA may have more than two terminals per net while the analogous problem in graph drawing generally only involves pairs of vertices for each edge.
Software

Software, systems, and providers of systems for drawing graphs include:
- BioFabric,[8] open-source software from the Institute of Systems Biology for visualizing large networks by drawing nodes as horizontal lines.
- Cytoscape, open-source software for visualizing molecular interaction networks
- Gephi, open-source network analysis and visualization software
- Graphviz, an open-source graph drawing system from AT&T Corporation[28]
- Mathematica, a general purpose computation tool that includes 2D and 3D graph visualization and graph analysis tools.[29][30]
- Microsoft Automatic Graph Layout, a .NET library (formerly called GLEE) for laying out graphs[31]
- Tom Sawyer Software[32] Tom Sawyer Perspectives is graphics-based software for building enterprise-class graph and data visualization and analysis applications. It is a Software Development Kit (SDK) with a graphics-based design and preview environment.
- Tulip (software),[33] an open source data visualization tool
- yEd, a graph editor with graph layout functionality[34]
- PGF/TikZ 3.0 with the
graphdrawingpackage (requires LuaTeX).[35] - LaNet-vi, an open-source large network visualization software
References
- Footnotes
- ↑ Di Battista et al. (1994), pp. vii–viii; Herman, Melançon & Marshall (2000), Section 1.1, "Typical Application Areas".
- 1 2 Di Battista et al. (1994), p. 6.
- 1 2 Di Battista et al. (1994), p. viii.
- ↑ Misue et al. (1995)
- ↑ Knuth, Donald E. (2013), "Two thousand years of combinatorics", in Wilson, Robin; Watkins, John J., Combinatorics: Ancient and Modern, Oxford University Press, pp. 7–37.
- ↑ Holten & van Wijk (2009); Holten et al. (2011).
- ↑ Garg & Tamassia (1995).
- 1 2 Longabaugh (2012).
- ↑ Di Battista et al. (1994), Section 2.1.2, Aesthetics, pp. 14–16; Purchase, Cohen & James (1997).
- ↑ Di Battista et al. (1994), p 14.
- ↑ Di Battista et al. (1994), p. 16.
- 1 2 Pach & Sharir (2009).
- ↑ Published in Grandjean, Martin (2014). "La connaissance est un réseau". Les Cahiers du Numérique. 10 (3): 37–54. doi:10.3166/lcn.10.3.37-54. Retrieved 2014-10-15.
- ↑ Di Battista et al. (1994), Section 2.7, "The Force-Directed Approach", pp. 29–30, and Chapter 10, "Force-Directed Methods", pp. 303–326.
- ↑ Beckman (1994); Koren (2005).
- ↑ Di Battista et al. (1994), Chapter 5, "Flow and Orthogonal Drawings", pp. 137–170; (Eiglsperger, Fekete & Klau 2001).
- ↑ Herman, Melançon & Marshall (2000), Section 2.2, "Traditional Layout – An Overview".
- ↑ Sugiyama, Tagawa & Toda (1981); Bastert & Matuszewski (2001); Di Battista et al. (1994), Chapter 9, "Layered Drawings of Digraphs", pp. 265–302.
- ↑ Saaty (1964).
- ↑ Doğrusöz, Madden & Madden (1997).
- ↑ Di Battista et al. (1994), Section 4.7, "Dominance Drawings", pp. 112–127.
- ↑ Scott (2000); Brandes, Freeman & Wagner (2014).
- ↑ Di Battista et al. (1994), pp. 15-16, and Chapter 6, "Flow and Upward Planarity", pp. 171–214; Freese (2004).
- ↑ Zapponi (2003).
- ↑ Anderson & Head (2006).
- ↑ Di Battista & Rimondini (2014).
- ↑ Bachmaier, Brandes & Schreiber (2014).
- ↑ "Graphviz and Dynagraph – Static and Dynamic Graph Drawing Tools", by John Ellson, Emden R. Gansner, Eleftherios Koutsofios, Stephen C. North, and Gordon Woodhull, in Jünger & Mutzel (2004).
- ↑ GraphPlot Mathematica documentation
- ↑ Graph drawing tutorial
- ↑ Nachmanson, Robertson & Lee (2008).
- ↑ Madden et al. (1996).
- ↑ "Tulip – A Huge Graph Visualization Framework", by David Auber, in Jünger & Mutzel (2004).
- ↑ "yFiles – Visualization and Automatic Layout of Graphs", by Roland Wiese, Markus Eiglsperger, and Michael Kaufmann, in Jünger & Mutzel (2004).
- ↑ Tantau (2013); see also the older GD 2012 presentation
- General references
- Di Battista, Giuseppe; Eades, Peter; Tamassia, Roberto; Tollis, Ioannis G. (1994), "Algorithms for Drawing Graphs: an Annotated Bibliography", Computational Geometry: Theory and Applications, 4: 235–282, doi:10.1016/0925-7721(94)00014-x.
- Di Battista, Giuseppe; Eades, Peter; Tamassia, Roberto; Tollis, Ioannis G. (1998), Graph Drawing: Algorithms for the Visualization of Graphs, Prentice Hall, ISBN 978-0-13-301615-4.
- Herman, Ivan; Melançon, Guy; Marshall, M. Scott (2000), "Graph Visualization and Navigation in Information Visualization: A Survey", IEEE Transactions on Visualization and Computer Graphics, 6 (1): 24–43, doi:10.1109/2945.841119.
- Jünger, Michael; Mutzel, Petra (2004), Graph Drawing Software, Springer-Verlag, ISBN 978-3-540-00881-1.
- Kaufmann, Michael; Wagner, Dorothea, eds. (2001), Drawing Graphs: Methods and Models, Lecture Notes in Computer Science, 2025, Springer-Verlag, doi:10.1007/3-540-44969-8.
- Tamassia, Roberto, ed. (2014), Handbook of Graph Drawing and Visualization, CRC Press.
- Specialized subtopics
- Anderson, James Andrew; Head, Thomas J. (2006), Automata Theory with Modern Applications, Cambridge University Press, pp. 38–41, ISBN 978-0-521-84887-9.
- Bachmaier, Christian; Brandes, Ulrik; Schreiber, Falk (2014), "Biological Networks", in Tamassia, Roberto, Handbook of Graph Drawing and Visualization, CRC Press, pp. 621–651.
- Bastert, Oliver; Matuszewski, Christian (2001), "Layered drawings of digraphs", in Kaufmann, Michael; Wagner, Dorothea, Drawing Graphs: Methods and Models, Lecture Notes in Computer Science, 2025, Springer-Verlag, pp. 87–120, doi:10.1007/3-540-44969-8_5.
- Beckman, Brian (1994), Theory of Spectral Graph Layout, Tech. Report MSR-TR-94-04, Microsoft Research.
- Brandes, Ulrik; Freeman, Linton C.; Wagner, Dorothea (2014), "Social Networks", in Tamassia, Roberto, Handbook of Graph Drawing and Visualization, CRC Press, pp. 805–839.
- Di Battista, Giuseppe; Rimondini, Massimo (2014), "Computer Networks", in Tamassia, Roberto, Handbook of Graph Drawing and Visualization, CRC Press, pp. 763–803.
- Doğrusöz, Uğur; Madden, Brendan; Madden, Patrick (1997), "Circular layout in the Graph Layout toolkit", in North, Stephen, Symposium on Graph Drawing, GD '96 Berkeley, California, USA, September 18–20, 1996, Proceedings, Lecture Notes in Computer Science, 1190, Springer-Verlag, pp. 92–100, doi:10.1007/3-540-62495-3_40.
- Eiglsperger, Markus; Fekete, Sándor; Klau, Gunnar (2001), "Orthogonal graph drawing", in Kaufmann, Michael; Wagner, Dorothea, Drawing Graphs, Lecture Notes in Computer Science, 2025, Springer Berlin / Heidelberg, pp. 121–171, doi:10.1007/3-540-44969-8_6.
- Freese, Ralph (2004), "Automated lattice drawing", in Eklund, Peter, Concept Lattices: Second International Conference on Formal Concept Analysis, ICFCA 2004, Sydney, Australia, February 23-26, 2004, Proceedings (PDF), Lecture Notes in Computer Science, 2961, Springer-Verlag, pp. 589–590, doi:10.1007/978-3-540-24651-0_12.
- Garg, Ashim; Tamassia, Roberto (1995), "Upward planarity testing", Order, 12 (2): 109–133, doi:10.1007/BF01108622, MR 1354797.
- Holten, Danny; Isenberg, Petra; van Wijk, Jarke J.; Fekete, Jean-Daniel (2011), "An extended evaluation of the readability of tapered, animated, and textured directed-edge representations in node-link graphs", IEEE Pacific Visualization Symposium (PacificVis 2011) (PDF), pp. 195–202, doi:10.1109/PACIFICVIS.2011.5742390.
- Holten, Danny; van Wijk, Jarke J. (2009), "A user study on visualizing directed edges in graphs", Proceedings of the 27th International Conference on Human Factors in Computing Systems (CHI '09) (PDF), pp. 2299–2308, doi:10.1145/1518701.1519054.
- Koren, Yehuda (2005), "Drawing graphs by eigenvectors: theory and practice" (PDF), Computers & Mathematics with Applications, 49 (11-12): 1867–1888, doi:10.1016/j.camwa.2004.08.015, MR 2154691.
- Longabaugh, William (2012), "Combing the hairball with BioFabric: a new approach for visualization of large networks" (PDF), BMC Bioinformatics, 13: 275, doi:10.1186/1471-2105-13-275, PMID 23102059.
- Madden, Brendan; Madden, Patrick; Powers, Steve; Himsolt, Michael (1996), "Portable graph layout and editing", in Brandenburg, Franz J., Graph Drawing: Symposium on Graph Drawing, GD '95, Passau, Germany, September 20–22, 1995, Proceedings, Lecture Notes in Computer Science, 1027, Springer-Verlag, pp. 385–395, doi:10.1007/BFb0021822.
- Misue, K.; Eades, P.; Lai, W.; Sugiyama, K. (1995), "Layout Adjustment and the Mental Map", Journal of Visual Languages and Computing, 6 (2): 183–210, doi:10.1006/jvlc.1995.1010.
- Nachmanson, Lev; Robertson, George; Lee, Bongshin (2008), "Drawing Graphs with GLEE" (PDF), in Hong, Seok-Hee; Nishizeki, Takao; Quan, Wu, Graph Drawing, 15th International Symposium, GD 2007, Sydney, Australia, September 24–26, 2007, Revised Papers, Lecture Notes in Computer Science, 4875, Springer-Verlag, pp. 389–394, doi:10.1007/978-3-540-77537-9_38.
- Pach, János; Sharir, Micha (2009), "5.5 Angular resolution and slopes", Combinatorial Geometry and Its Algorithmic Applications: The Alcalá Lectures, Mathematical Surveys and Monographs, 152, American Mathematical Society, pp. 126–127.
- Purchase, H. C.; Cohen, R. F.; James, M. I. (1997), "An experimental study of the basis for graph drawing algorithms" (PDF), Journal of Experimental Algorithmics, 2, Article 4, doi:10.1145/264216.264222.
- Saaty, Thomas L. (1964), "The minimum number of intersections in complete graphs", Proc. Natl. Acad. Sci. U.S.A., 52: 688–690, doi:10.1073/pnas.52.3.688.
- Scott, John (2000), "Sociograms and Graph Theory", Social network analysis: a handbook (2nd ed.), Sage, pp. 64–69, ISBN 978-0-7619-6339-4.
- Sugiyama, Kozo; Tagawa, Shôjirô; Toda, Mitsuhiko (1981), "Methods for visual understanding of hierarchical system structures", IEEE Transactions on Systems, Man, and Cybernetics, SMC-11 (2): 109–125, doi:10.1109/TSMC.1981.4308636, MR 0611436.
- Tantau, Till (2013), "Graph Drawing in TikZ", Journal of Graph Algorithms and Applications, 17 (4): 495–513, doi:10.7155/jgaa.00301.
- Zapponi, Leonardo (August 2003), "What is a Dessin d'Enfant" (PDF), Notices of the American Mathematical Society, 50: 788–789.
External links
- GraphX library for .NET: open-source WPF library for graph calculation and visualization. Supports many layout and edge routing algorithms.
- Graph drawing e-print archive: including information on papers from all Graph Drawing symposia.
- Graph drawing at DMOZ for many additional links related to graph drawing.