Gibbs phenomenon
In mathematics, the Gibbs phenomenon, discovered by Henry Wilbraham (1848)[1] and rediscovered by J. Willard Gibbs (1899),[2] is the peculiar manner in which the Fourier series of a piecewise continuously differentiable periodic function behaves at a jump discontinuity. The nth partial sum of the Fourier series has large oscillations near the jump, which might increase the maximum of the partial sum above that of the function itself. The overshoot does not die out as n increases, but approaches a finite limit.[3] This sort of behavior was also observed by experimental physicists, but was believed to be due to imperfections in the measuring apparatuses.[4]
This is one cause of ringing artifacts in signal processing.
Description


The Gibbs phenomenon involves both the fact that Fourier sums overshoot at a jump discontinuity, and that this overshoot does not die out as more terms are added to the sum.
The three pictures on the right demonstrate the phenomenon for a square wave (of height ) whose Fourier expansion is


More precisely, this is the function f which equals between and and between and for every integer n; thus this square wave has a jump discontinuity of height at every integer multiple of .


As can be seen, as the number of terms rises, the error of the approximation is reduced in width and energy, but converges to a fixed height. A calculation for the square wave (see Zygmund, chap. 8.5., or the computations at the end of this article) gives an explicit formula for the limit of the height of the error. It turns out that the Fourier series exceeds the height of the square wave by
- (
 A243268)

or about 9 percent of the jump. More generally, at any jump point of a piecewise continuously differentiable function with a jump of a, the nth partial Fourier series will (for n very large) overshoot this jump by approximately at one end and undershoot it by the same amount at the other end; thus the "jump" in the partial Fourier series will be about 18% larger than the jump in the original function. At the location of the discontinuity itself, the partial Fourier series will converge to the midpoint of the jump (regardless of what the actual value of the original function is at this point). The quantity

- ( A036792)

is sometimes known as the Wilbraham–Gibbs constant.
History
The Gibbs phenomenon was first noticed and analyzed by Henry Wilbraham in a 1848 paper.[5] The paper attracted little attention until 1914 when it was mentioned in Heinrich Burkhardt's review of mathematical analysis in Klein's encyclopedia.[6] In 1898, Albert A. Michelson developed a device that could compute and re-synthesize the Fourier series.[7] A widespread myth says that when the Fourier coefficients for a square wave were input to the machine, the graph would oscillate at the discontinuities, and that because it was a physical device subject to manufacturing flaws, Michelson was convinced that the overshoot was caused by errors in the machine. In fact the graphs produced by the machine were not good enough to exhibit the Gibbs phenomenon clearly, and Michelson may not have noticed it as he made no mention of this effect in his paper (Michelson & Stratton 1898) about his machine or his later letters to Nature.[1] Inspired by some correspondence in Nature between Michelson and Love about the convergence of the Fourier series of the square wave function, in 1898 J. Willard Gibbs published a short note in which he considered what today would be called a sawtooth wave and pointed out the important distinction between the limit of the graphs of the partial sums of the Fourier series, and the graph of the function that is the limit of those partial sums. In his first letter Gibbs failed to notice the Gibbs phenomenon, and the limit that he described for the graphs of the partial sums was inaccurate. In 1899 he published a correction in which he described the overshoot at the point of discontinuity (Nature: April 27, 1899, p. 606). In 1906, Maxime Bôcher gave a detailed mathematical analysis of that overshoot, coining the term "Gibbs' phenomenon"[8] and bringing the term into widespread use.[1]
After the existence of Henry Wilbraham's paper became widely known, in 1925 Horatio Scott Carslaw remarked "We may still call this property of Fourier's series (and certain other series) Gibbs' phenomenon; but we must no longer claim that the property was first discovered by Gibbs."[9]
Explanation
Informally, the Gibbs phenomenon reflects the difficulty inherent in approximating a discontinuous function by a finite series of continuous sine and cosine waves. It is important to put emphasis on the word finite because even though every partial sum of the Fourier series overshoots the function it is approximating, the limit of the partial sums does not. The value of x where the maximum overshoot is achieved moves closer and closer to the discontinuity as the number of terms summed increases so, again informally, once the overshoot has passed by a particular x, convergence at the value of x is possible.
There is no contradiction in the overshoot converging to a non-zero amount, but the limit of the partial sums having no overshoot, because the location of that overshoot moves. We have pointwise convergence, but not uniform convergence. For a piecewise C1 function the Fourier series converges to the function at every point except at the jump discontinuities. At the jump discontinuities themselves the limit will converge to the average of the values of the function on either side of the jump. This is a consequence of the Dirichlet theorem.[10]
The Gibbs phenomenon is also closely related to the principle that the decay of the Fourier coefficients of a function at infinity is controlled by the smoothness of that function; very smooth functions will have very rapidly decaying Fourier coefficients (resulting in the rapid convergence of the Fourier series), whereas discontinuous functions will have very slowly decaying Fourier coefficients (causing the Fourier series to converge very slowly). Note for instance that the Fourier coefficients 1, −1/3, 1/5, ... of the discontinuous square wave described above decay only as fast as the harmonic series, which is not absolutely convergent; indeed, the above Fourier series turns out to be only conditionally convergent for almost every value of x. This provides a partial explanation of the Gibbs phenomenon, since Fourier series with absolutely convergent Fourier coefficients would be uniformly convergent by the Weierstrass M-test and would thus be unable to exhibit the above oscillatory behavior. By the same token, it is impossible for a discontinuous function to have absolutely convergent Fourier coefficients, since the function would thus be the uniform limit of continuous functions and therefore be continuous, a contradiction. See more about absolute convergence of Fourier series.
Solutions
In practice, the difficulties associated with the Gibbs phenomenon can be ameliorated by using a smoother method of Fourier series summation, such as Fejér summation or Riesz summation, or by using sigma-approximation. Using a continuous wavelet transform, the wavelet Gibbs phenomenon never exceeds the Fourier Gibbs phenomenon.[11] Also, using the discrete wavelet transform with Haar basis functions, the Gibbs phenomenon does not occur at all in the case of continuous data at jump discontinuities,[12] and is minimal in the discrete case at large change points. In wavelet analysis, this is commonly referred to as the Longo phenomenon.
Formal mathematical description of the phenomenon
Let be a piecewise continuously differentiable function which is periodic with some period . Suppose that at some point , the left limit and right limit of the function differ by a non-zero gap :


For each positive integer N ≥ 1, let SN f be the Nth partial Fourier series

where the Fourier coefficients are given by the usual formulae


Then we have

and

but

More generally, if is any sequence of real numbers which converges to as , and if the gap a is positive then


and

If instead the gap a is negative, one needs to interchange limit superior with limit inferior, and also interchange the ≤ and ≥ signs, in the above two inequalities.
Signal processing explanation
.svg.png)
From a signal processing point of view, the Gibbs phenomenon is the step response of a low-pass filter, and the oscillations are called ringing or ringing artifacts. Truncating the Fourier transform of a signal on the real line, or the Fourier series of a periodic signal (equivalently, a signal on the circle) corresponds to filtering out the higher frequencies by an ideal (brick-wall) low-pass/high-cut filter. This can be represented as convolution of the original signal with the impulse response of the filter (also known as the kernel), which is the sinc function. Thus the Gibbs phenomenon can be seen as the result of convolving a Heaviside step function (if periodicity is not required) or a square wave (if periodic) with a sinc function: the oscillations in the sinc function cause the ripples in the output.
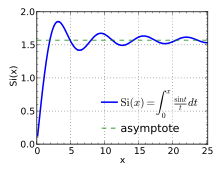
In the case of convolving with a Heaviside step function, the resulting function is exactly the integral of the sinc function, the sine integral; for a square wave the description is not as simply stated. For the step function, the magnitude of the undershoot is thus exactly the integral of the (left) tail, integrating to the first negative zero: for the normalized sinc of unit sampling period, this is The overshoot is accordingly of the same magnitude: the integral of the right tail, or, which amounts to the same thing, the difference between the integral from negative infinity to the first positive zero, minus 1 (the non-overshooting value).

The overshoot and undershoot can be understood thus: kernels are generally normalized to have integral 1, so they result in a mapping of constant functions to constant functions – otherwise they have gain. The value of a convolution at a point is a linear combination of the input signal, with coefficients (weights) the values of the kernel. If a kernel is non-negative, such as for a Gaussian kernel, then the value of the filtered signal will be a convex combination of the input values (the coefficients (the kernel) integrate to 1, and are non-negative), and will thus fall between the minimum and maximum of the input signal – it will not undershoot or overshoot. If, on the other hand, the kernel assumes negative values, such as the sinc function, then the value of the filtered signal will instead be an affine combination of the input values, and may fall outside of the minimum and maximum of the input signal, resulting in undershoot and overshoot, as in the Gibbs phenomenon.
Taking a longer expansion – cutting at a higher frequency – corresponds in the frequency domain to widening the brick-wall, which in the time domain corresponds to narrowing the sinc function and increasing its height by the same factor, leaving the integrals between corresponding points unchanged. This is a general feature of the Fourier transform: widening in one domain corresponds to narrowing and increasing height in the other. This results in the oscillations in sinc being narrower and taller and, in the filtered function (after convolution), yields oscillations that are narrower and thus have less area, but does not reduce the magnitude: cutting off at any finite frequency results in a sinc function, however narrow, with the same tail integrals. This explains the persistence of the overshoot and undershoot.
-
Oscillations can be interpreted as convolution with a sinc.
-
Higher cutoff makes the sinc narrower but taller, with the same magnitude tail integrals, yielding higher frequency oscillations, but whose magnitude does not vanish.
Thus the features of the Gibbs phenomenon are interpreted as follows:
- the undershoot is due to the impulse response having a negative tail integral, which is possible because the function takes negative values;
- the overshoot offsets this, by symmetry (the overall integral does not change under filtering);
- the persistence of the oscillations is because increasing the cutoff narrows the impulse response, but does not reduce its integral – the oscillations thus move towards the discontinuity, but do not decrease in magnitude.
The square wave example

In the square wave case the period L is , the discontinuity is at zero, and the jump a is equal to . For simplicity let us just deal with the case when N is even (the case of odd N is very similar). Then we have


Substituting , we obtain


as claimed above. Next, we compute

If we introduce the normalized sinc function, , we can rewrite this as

![S_{N}f\left({\frac {2\pi }{2N}}\right)={\frac {\pi }{2}}\left[{\frac {2}{N}}\operatorname {sinc}\left({\frac {1}{N}}\right)+{\frac {2}{N}}\operatorname {sinc}\left({\frac {3}{N}}\right)+\cdots +{\frac {2}{N}}\operatorname {sinc}\left({\frac {(N-1)}{N}}\right)\right].](../I/m/0fc61565d3491263480608bf2e06b352ec334a4b.svg)
But the expression in square brackets is a numerical integration approximation to the integral (more precisely, it is a midpoint rule approximation with spacing ). Since the sinc function is continuous, this approximation converges to the actual integral as . Thus we have


![{\displaystyle {\begin{aligned}\lim _{N\to \infty }S_{N}f\left({\frac {2\pi }{2N}}\right)&={\frac {\pi }{2}}\int _{0}^{1}\operatorname {sinc} (x)\,dx\\[8pt]&={\frac {1}{2}}\int _{x=0}^{1}{\frac {\sin(\pi x)}{\pi x}}\,d(\pi x)\\[8pt]&={\frac {1}{2}}\int _{0}^{\pi }{\frac {\sin(t)}{t}}\ dt\quad =\quad {\frac {\pi }{4}}+{\frac {\pi }{2}}\cdot (0.089489872236\dots ),\end{aligned}}}](../I/m/4119e199baf2323bc36b18b35a6de7122bf9ed51.svg)
which was what was claimed in the previous section. A similar computation shows

Consequences
In signal processing, the Gibbs phenomenon is undesirable because it causes artifacts, namely clipping from the overshoot and undershoot, and ringing artifacts from the oscillations. In the case of low-pass filtering, these can be reduced or eliminated by using different low-pass filters.
In MRI, the Gibbs phenomenon causes artifacts in the presence of adjacent regions of markedly differing signal intensity. This is most commonly encountered in spinal MR imaging, where the Gibbs phenomenon may simulate the appearance of syringomyelia.
See also
- σ-approximation which adjusts a Fourier summation to eliminate the Gibbs phenomenon which would otherwise occur at discontinuities
- Pinsky phenomenon
- Compare with Runge's phenomenon for polynomial approximations
- Sine integral
- Mach bands
Notes
- 1 2 3 Hewitt, Edwin; Hewitt, Robert E. (1979). "The Gibbs-Wilbraham phenomenon: An episode in Fourier analysis". Archive for History of Exact Sciences. 21 (2): 129–160. doi:10.1007/BF00330404. Retrieved 16 September 2011. Available on-line at: National Chiao Tung University: Open Course Ware: Hewitt & Hewitt, 1979.
- ↑ Andrew Dimarogonas. Vibration for engineers. ISBN 0-13-462938-8.
- ↑ H. S. Carslaw (1930). Introduction to the theory of Fourier's series and integrals (Third ed.). New York: Dover Publications Inc. Chapter IX.
- ↑ Vretblad 2000 Section 4.7.
- ↑ Wilbraham, Henry (1848) "On a certain periodic function," The Cambridge and Dublin Mathematical Journal, 3 : 198-201.
- ↑ Encyklopädie der Mathematischen Wissenschaften mit Einschluss ihrer Anwendungen (PDF). Vol II T. 1 H 1. Wiesbaden: Vieweg+Teubner Verlag. 1914. p. 1049. Retrieved 14 September 2016.
- ↑ Hammack, Bill; Kranz, Steve; Carpenter, Bruce. Albert Michelson's Harmonic Analyzer: A Visual Tour of a Nineteenth Century Machine that Performs Fourier Analysis. Articulate Noise Books. ISBN 9780983966173. Retrieved 14 September 2016.
- ↑ Bôcher, Maxime (April 1906) "Introduction to the theory of Fourier's series," Annals of Mathethematics, second series, 7 (3) : 81-152. The Gibbs phenomenon is discussed on pages 123-132; Gibbs' role is mentioned on page 129.
- ↑ Carslaw, H. S. (1 October 1925). "A historical note on Gibbs' phenomenon in Fourier's series and integrals". Bulletin of the American Mathematical Society. 31 (8): 420–424. ISSN 0002-9904. Retrieved 14 September 2016.
- ↑ M. Pinsky (2002). Introduction to Fourier Analysis and Wavelets. United states of America: Brooks/Cole. p. 27.
- ↑ Rasmussen, Henrik O. "The Wavelet Gibbs Phenomenon." In "Wavelets, Fractals and Fourier Transforms", Eds M. Farge et al., Clarendon Press, Oxford, 1993.
- ↑ Kelly, Susan E. "Gibbs Phenomenon for Wavelets." Applied and Computational Harmonic Analysis 3, 1995. http://www.uwlax.edu/faculty/kelly/Publications/GibbsJan.pdf
References
- Gibbs, J. Willard (1898), "Fourier's Series", Nature, 59 (1522): 200, doi:10.1038/059200b0, ISSN 0028-0836
- Gibbs, J. Willard (1899), "Fourier's Series", Nature, 59 (1539): 606, doi:10.1038/059606a0, ISSN 0028-0836
- Michelson, A. A.; Stratton, S. W. (1898), "A new harmonic analyser", Philosophical Magazine, 5 (45): 85–91
- Antoni Zygmund, Trigonometrical series, Dover publications, 1955.
- Wilbraham, Henry (1848), "On a certain periodic function", The Cambridge and Dublin Mathematical Journal, 3: 198–201
- Paul J. Nahin, Dr. Euler's Fabulous Formula, Princeton University Press, 2006. Ch. 4, Sect. 4.
- Vretblad, Anders (2000), Fourier Analysis and its Applications, Graduate Texts in Mathematics, 223, New York: Springer Publishing, ISBN 0-387-00836-5
External links
- Hazewinkel, Michiel, ed. (2001), "Gibbs phenomenon", Encyclopedia of Mathematics, Springer, ISBN 978-1-55608-010-4
- Weisstein, Eric W., "Gibbs Phenomenon". From MathWorld—A Wolfram Web Resource.
- Prandoni, Paolo, "Gibbs Phenomenon".
- Radaelli-Sanchez, Ricardo, and Richard Baraniuk, "Gibbs Phenomenon". The Connexions Project. (Creative Commons Attribution License)
- Horatio S Carslaw : Introduction to the theory of Fourier's series and integrals.pdf (introductiontot00unkngoog.pdf ) at archive.org