German federal election, 1990
| | ||||||||||||||||||||||||||||||||||||||||||||||||||||||||||||||||||||||||||||||||||||||||||||||||
| ||||||||||||||||||||||||||||||||||||||||||||||||||||||||||||||||||||||||||||||||||||||||||||||||
| ||||||||||||||||||||||||||||||||||||||||||||||||||||||||||||||||||||||||||||||||||||||||||||||||
|
| ||||||||||||||||||||||||||||||||||||||||||||||||||||||||||||||||||||||||||||||||||||||||||||||||
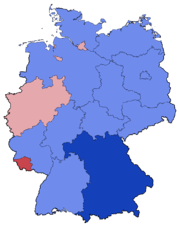
| Party list election results by state: dark blue denotes states where CSU had the absolute majority of the votes; lighter blue denotes states where CDU had the plurality of votes; red denotes states where the SPD had the absolute majority of the votes; and pink denotes states where the SPD had the plurality of votes | ||||||||||||||||||||||||||||||||||||||||||||||||||||||||||||||||||||||||||||||||||||||||||||||||
| ||||||||||||||||||||||||||||||||||||||||||||||||||||||||||||||||||||||||||||||||||||||||||||||||
.jpg)
.jpg)


German federal elections took place on 2 December 1990, to elect members to the 12th Bundestag (parliament) of the Federal Republic of Germany. It was the first free and universal election in all of Germany since the election of 1932 which cemented Adolf Hitler's power. The result was a comprehensive victory for the governing coalition of the Christian Democratic Union/Christian Social Union and the Free Democratic Party, which was reelected to a third term.
Issues and campaign
This was the first election conducted after German reunification which took place on 3 October. Almost 150 seats had been added to represent the newly re-established eastern states of Germany without reducing the number of Western members. The euphoria following the reunification gave the ruling CDU/CSU–FDP coalition a dramatic advantage in both Western and Eastern Germany throughout the campaign.
Results
 |
| This article is part of a series on the politics and government of Germany |
|
Constitution ("Fundamental Law Code") |
|
| Foreign relations |
All change figures are relative to the pre-existing West German Bundestag.
| Parties | Constituency | Party list | Total seats | |||||||||||||
|---|---|---|---|---|---|---|---|---|---|---|---|---|---|---|---|---|
| Votes | % | +/− | Seats | +/− | Votes | % | +/− | Seats | +/− | Seats | +/− | % | ||||
| Christian Democratic Union (CDU) | 17,707,574 | 38.3 | +0.8 | 192 | +68 | 17,055,116 | 36.7 | +2.3 | 76 | +26 | 268 | +83 | 40.5 | |||
| Social Democratic Party (SPD) | 16,279,980 | 35.2 | −4.0 | 91 | +12 | 15,545,366 | 33.5 | −3.5 | 148 | +41 | 239 | +46 | 36.1 | |||
| Free Democratic Party (FDP) | 3,595,135 | 7.8 | +3.1 | 1 | +1 | 5,123,233 | 11.0 | +1.9 | 78 | +32 | 79 | +31 | 11.9 | |||
| Christian Social Union (CSU) | 3,423,904 | 7.4 | −2.8 | 43 | −2 | 3,302,980 | 7.1 | −2.7 | 8 | +4 | 51 | +2 | 7.7 | |||
| Party of Democratic Socialism (PDS) | 1,049,245 | 2.3 | +2.3 | 1 | +1 | 1,129,578 | 2.4 | +2.4 | 16 | +16 | 17 | +17 | 2.6 | |||
| Alliance '90/The Greens (B90/Gr.) (East) | 552,027 | 1.2 | +1.2 | 0 | ±0 | 559,207 | 1.2 | +1.2 | 8 | +8 | 8 | +8 | 1.2 | |||
| The Greens (West) | 2,037,885 | 4.4 | −2.6 | 0 | ±0 | 1,788,200 | 3.8 | −4.5 | 0 | −42 | 0 | −44 | 0 | |||
| The Republicans (REP) | 767,652 | 1.7 | +1.7 | 0 | ±0 | 987,269 | 2.1 | +2.1 | 0 | ±0 | 0 | ±0 | 0 | |||
| The Grays – Gray Panthers (GRAUE) | 218,412 | 0.5 | +0.5 | 0 | ±0 | 385,910 | 0.8 | +0.8 | 0 | ±0 | 0 | ±0 | 0 | |||
| Ecological Democratic Party (ÖDP) | 243,469 | 0.5 | +0.4 | 0 | ±0 | 205,206 | 0.4 | +0.1 | 0 | ±0 | 0 | ±0 | 0 | |||
| National Democratic Party (NPD) | 190,105 | 0.4 | −0.1 | 0 | ±0 | 145,776 | 0.3 | −0.3 | 0 | ±0 | 0 | ±0 | 0 | |||
| German Social Union (DSU) | 131,747 | 0.3 | +0.3 | 0 | ±0 | 89,008 | 0.2 | +0.2 | 0 | ±0 | 0 | ±0 | 0 | |||
| Christian League (Liga) | 8,667 | 0.0 | +0.0 | 0 | ±0 | 39,640 | 0.1 | +0.1 | 0 | ±0 | 0 | ±0 | 0 | |||
| Christian Centre (CM) | 9,824 | 0.0 | +0.0 | 0 | ±0 | 36,466 | 0.1 | +0.1 | 0 | ±0 | 0 | ±0 | 0 | |||
| Bavaria Party (BP) | 10,836 | 0.0 | ±0 | 0 | ±0 | 31,315 | 0.1 | ±0 | 0 | ±0 | 0 | ±0 | 0 | |||
| The Women (FRAUEN) | 1,433 | 0.0 | +0.0 | 0 | ±0 | 12,077 | 0.0 | −0.2 | 0 | ±0 | 0 | ±0 | 0 | |||
| Patriots for Germany (Patrioten) | 746 | 0.0 | −0.1 | 0 | ±0 | 4,687 | 0.0 | −0.1 | 0 | ±0 | 0 | ±0 | 0 | |||
| Eco-Union (ÖKO-UNION) | 1,106 | 0.0 | +0.0 | 0 | ±0 | 4,661 | 0.0 | +0.0 | 0 | ±0 | 0 | ±0 | 0 | |||
| Union of Working Groups for Employee Politics and Democracy (VAA) | 704 | 0.0 | +0.0 | 0 | ±0 | 4,530 | 0.0 | +0.0 | 0 | ±0 | 0 | ±0 | 0 | |||
| Communist Party of Germany (KPD) | – | – | – | – | – | 1,630 | 0.0 | +0.0 | 0 | ±0 | 0 | ±0 | 0 | |||
| Spartacist Workers' Party of Germany (SpAD) | 124 | 0.0 | +0.0 | 0 | ±0 | 1,610 | 0.0 | +0.0 | 0 | ±0 | 0 | ±0 | 0 | |||
| Federation of German Democrats (DDD) | 474 | 0.0 | +0.0 | 0 | ±0 | 1,009 | 0.0 | +0.0 | 0 | ±0 | 0 | ±0 | 0 | |||
| Federation of Socialist Workers (BSA) | 214 | 0.0 | +0.0 | 0 | ±0 | 826 | 0.0 | +0.0 | 0 | ±0 | 0 | ±0 | 0 | |||
| Responsible Citizens | 72 | 0.0 | ±0 | 0 | ±0 | 492 | 0.0 | −0.1 | 0 | ±0 | 0 | ±0 | 0 | |||
| European Federalist Party (EFP) | 266 | 0.0 | +0.0 | 0 | ±0 | – | – | – | – | – | 0 | ±0 | 0 | |||
| Electoral groups and independents | 43,324 | 0.1 | −0.6 | 0 | ±0 | – | – | – | – | – | 0 | ±0 | 0 | |||
| Invalid/blank votes | 720,990 | — | — | — | — | 540,143 | — | — | — | — | — | — | — | |||
| Totals | 46,995,915 | 100 | ±0.0 | 328 | +80 | 46,995,915 | 100 | ±0.0 | 334 | +85 | 662 | +143 | ±0 | |||
| Registered voters/turnout | 60,436,560 | 77.8 | — | — | — | 60,436,560 | 77.8 | — | — | — | — | — | — | |||
| Source: Federal Returning Officer | ||||||||||||||||
This was the one and only election for which the 5% threshold was not applied nationwide, but separately for East and West. As a result, while the Western Greens failed to gain representation, an ideologically similar party from the East, Alliance 90, did.
| 319 | 79 | 239 | 17 | 8 |
| CDU/CSU | FDP | SPD | PDS |
Post-election
The governing CDU/CSU-FDP coalition was returned to office with a landslide majority, and Helmut Kohl remained chancellor. The CDU did exceptionally well in the former East Germany, which had been the heartland of the SPD before the Nazi era.

References
- ↑ "Voter turnout by election year". Website of the Federal Returning Officer's Office. The Federal Returning Officer. Retrieved 7 November 2014.
Sources
| Parliamentary elections | |
|---|---|
| Presidential elections | |
| European elections | |
| Referendums | |
| |