German federal election, 1920
German federal election, 1920
.svg.png)
|
|
|
|
All 459 seats in the Reichstag
230 seats needed for a majority |
| Turnout |
79.2% |
| |
First party |
Second party |
Third party |
| |
.jpg) |
 |
 |
| Leader |
Hermann Müller |
Arthur Crispien |
Oskar Hergt |
| Party |
SPD |
USPD |
DNVP |
| Leader since |
1919 |
1919 |
1920 |
| Last election |
165 seats |
22 seats |
44 seats |
| Seats won |
102 |
84 |
71 |
| Seat change |
 63 63 |
 62 62 |
27 |
| Popular vote |
6,104,398 |
5,046,813 |
4,249,100 |
| Percentage |
21.7% |
17.9% |
15.1% |
| Swing |
16.2% |
10.3% |
4.8% |
|
| |
Fourth party |
Fifth party |
Sixth party |
| |
 |
|
|
| Leader |
Gustav Stresemann |
Karl Trimborn |
? |
| Party |
DVP |
Centre |
DDP |
| Leader since |
1919 |
1919 |
? |
| Last election |
19 seats |
91 seats |
75 seats |
| Seats won |
65 |
64 |
39 |
| Seat change |
46 |
27 |
36 |
| Popular vote |
3,919,446 |
3,845,001 |
2,333,741 |
| Percentage |
13.9% |
13.6% |
8.3% |
| Swing |
9.5% |
6.1% |
10.3% |
|
|
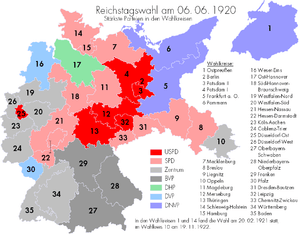
| Electoral map (in German) |
|
|

Seats in the 1st German Reichstag
Federal elections were held in Germany on 6 June 1920.[1] The Social Democratic Party remained the largest party in the Reichstag, although it lost over a third of its seats.[2] Voter turnout was 79.2%.[3]
Results
| Party |
Votes |
% |
Seats |
+/– |
|---|
| Social Democratic Party | 6,104,398 | 21.7 | 102 | −63 |
| Independent Social Democratic Party of Germany | 5,046,813 | 17.9 | 84 | +62 |
| German National People's Party | 4,249,100 | 15.1 | 71 | +27 |
| German People's Party | 3,919,446 | 13.9 | 65 | +46 |
| Centre Party | 3,845,001 | 13.6 | 64 | −27 |
| German Democratic Party | 2,333,741 | 8.3 | 39 | −36 |
| Bavarian People's Party | 1,173,344 | 4.2 | 20 | New |
| Communist Party of Germany | 589,454 | 2.1 | 4 | New |
| German-Hanoverian Party | 319,108 | 1.1 | 5 | +4 |
| Bavarian Peasants' League | 218,596 | 0.8 | 4 | 0 |
| Poland Party | 89,228 | 0.3 | 0 | New |
| German Economic League for City and Country | 88,800 | 0.3 | 0 | New |
| Christian People's Party | 65,260 | 0.3 | 1 | New |
| Polish Catholic Party of Upper Silesia | 51,437 | 0.2 | 0 | New |
| Schleswig-Holstein State Party | 25,907 | 0.1 | 0 | New |
| German Social Party | 22,958 | 0.1 | 0 | New |
| German Middle Class Party | 21,255 | 0.1 | 0 | New |
| Lusatian People's Party | 8,050 | 0.0 | 0 | New |
| German Socialist Party | 7,186 | 0.0 | 0 | New |
| Reform Group | 6,832 | 0.0 | 0 | New |
| Schleswig Club | 4,966 | 0.0 | 0 | New |
| National Democratic People's Party | 4,015 | 0.0 | 0 | New |
| Christian Social People's Party | 1,219 | 0.0 | 0 | New |
| Independent Party | 169 | 0.0 | 0 | New |
| German Economy and Labour Party | 43 | 0.0 | 0 | New |
| Upper Silesian Catholic People's Party | 6 | 0.0 | 0 | New |
| Invalid/blank votes | 267,249 | – | – | – |
| Total | 28,463,581 | 100 | 459 | +36 |
| Registered voters/turnout | 35,949,774 | 79.2 | – | – |
| Source: Nohlen & Stöver, Gonschior.de |
| Popular Vote |
|---|
|
|
|
|
|
| SPD |
|
21.65% |
| USPD |
|
17.90% |
| DNVP |
|
15.07% |
| DVP |
|
13.90% |
| Zentrum |
|
13.64% |
| DDP |
|
8.28% |
| BVP |
|
4.16% |
| KPD |
|
2.09% |
| Other |
|
3.31% |
| Reichstag seats |
|---|
|
|
|
|
|
| SPD |
|
22.22% |
| USPD |
|
18.30% |
| DNVP |
|
15.47% |
| DVP |
|
14.16% |
| Zentrum |
|
13.94% |
| DDP |
|
8.50% |
| BVP |
|
4.36% |
| KPD |
|
0.87% |
| Other |
|
2.18% |
References
- ↑ Nohlen, D & Stöver, P (2010) Elections in Europe: A data handbook, p762 ISBN 978-3-8329-5609-7
- ↑ Nohlen & Stöver, p790
- ↑ Nohlen & Stöver, p776