GC-content
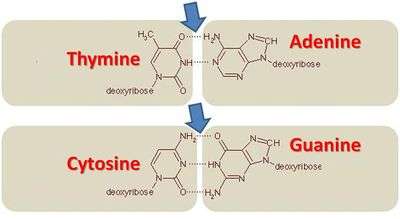
In molecular biology and genetics, GC-content (or guanine-cytosine content) is the percentage of nitrogenous bases on a DNA molecule that are either guanine or cytosine (from a possibility of four different ones, also including adenine and thymine).[1] This may refer to a specific fragment of DNA or RNA, or that of the whole genome. When it refers to a fragment of the genetic material, it may denote the GC-content of part of a gene (domain), single gene, group of genes (or gene clusters), or even a non-coding region. G (guanine) and C (cytosine) undergo a specific hydrogen bonding, whereas A (adenine) bonds specifically with T (thymine).
The GC pair is bound by three hydrogen bonds, while AT pairs are bound by two hydrogen bonds. To emphasize this difference in the number of hydrogen bonds, the base pairings can be represented as G≡C versus A=T. DNA with high GC-content is more stable than DNA with low GC-content; however, the hydrogen bonds do not stabilize the DNA significantly, and stabilization is due mainly to stacking interactions.[2] In spite of the higher thermostability conferred to the genetic material, it is envisaged that cells with DNA of high GC-content undergo autolysis, thereby reducing the longevity of the cell per se.[3] Due to the robustness endowed to the genetic materials in high GC organisms, it was commonly believed that the GC content played a vital part in adaptation temperatures, a hypothesis that has recently been refuted.[4] However, it has been shown that there is a strong correlation between the prokaryotic optimal growth at higher temperatures and the GC content of structured RNAs (such as ribosomal RNA, transfer RNA, and many other non-coding RNAs).[4][5] The GC base pairs are more stable than AU base pairs, because GC bonds have 3 hydrogen bonds and AU only has 2 hydrogen bonds, which makes high-GC-content RNA structures more tolerant of high temperatures. More recently, the first large-scale systematic gene-centric association analysis demonstrated the correlation between GC content and temperature for certain genomic regions while not for others.[6]
In PCR experiments, the GC-content of primers are used to predict their annealing temperature to the template DNA. A higher GC-content level indicates a higher melting temperature.
Determination of GC content
GC content is usually expressed as a percentage value, but sometimes as a ratio (called G+C ratio or GC-ratio). GC-content percentage is calculated as[7]

whereas the AT/GC ratio is calculated as[8]
- .

The GC-content percentages as well as GC-ratio can be measured by several means, but one of the simplest methods is to measure what is called the melting temperature of the DNA double helix using spectrophotometry. The absorbance of DNA at a wavelength of 260 nm increases fairly sharply when the double-stranded DNA separates into two single strands when sufficiently heated.[9] The most commonly used protocol for determining GC ratios uses flow cytometry for large number of samples.[10]
In alternative manner, if the DNA or RNA molecule under investigation has been sequenced then the GC-content can be accurately calculated by simple arithmetic or by using the free online GC calculator.
GC ratio of genomes
GC ratios within a genome is found to be markedly variable. These variations in GC ratio within the genomes of more complex organisms result in a mosaic-like formation with islet regions called isochores.[11] This results in the variations in staining intensity in the chromosomes.[12] GC-rich isochores include in them many protein coding genes, and thus determination of ratio of these specific regions contributes in mapping gene-rich regions of the genome.[13][14]
GC ratios and coding sequence
Within a long region of genomic sequence, genes are often characterised by having a higher GC-content in contrast to the background GC-content for the entire genome. Evidence of GC ratio with that of length of the coding region of a gene has shown that the length of the coding sequence is directly proportional to higher G+C content.[15] This has been pointed to the fact that the stop codon has a bias towards A and T nucleotides, and, thus, the shorter the sequence the higher the AT bias.[16]
Application in systematics
GC content is found to be variable with different organisms, the process of which is envisaged to be contributed to by variation in selection, mutational bias, and biased recombination-associated DNA repair.[17] The species problem in prokaryotic taxonomy has led to various suggestions in classifying bacteria, and the ad hoc committee on reconciliation of approaches to bacterial systematics has recommended use of GC ratios in higher level hierarchical classification.[18] For example, the Actinobacteria are characterised as "high GC-content bacteria".[19] In Streptomyces coelicolor A3(2), GC content is 72%.[20] The GC-content of Yeast (Saccharomyces cerevisiae) is 38%,[21] and that of another common model organism, Thale Cress (Arabidopsis thaliana), is 36%.[22] Because of the nature of the genetic code, it is virtually impossible for an organism to have a genome with a GC-content approaching either 0% or 100%. A species with an extremely low GC-content is Plasmodium falciparum (GC% = ~20%),[23] and it is usually common to refer to such examples as being AT-rich instead of GC-poor.[24]
See also
References
- ↑ Definition of GC – content on CancerWeb of Newcastle University,UK
- ↑ Yakovchuk P, Protozanova E, Frank-Kamenetskii MD (2006). "Base-stacking and base-pairing contributions into thermal stability of the DNA double helix". Nucleic Acids Res. 34 (2): 564–74. doi:10.1093/nar/gkj454. PMC 1360284
 . PMID 16449200.
 - ↑ Levin RE, Van Sickle C (1976). "Autolysis of high-GC isolates of Pseudomonas putrefaciens". Antonie Van Leeuwenhoek. 42 (1–2): 145–55. doi:10.1007/BF00399459. PMID 7999.
- 1 2 Hurst LD, Merchant AR (March 2001). "High guanine-cytosine content is not an adaptation to high temperature: a comparative analysis amongst prokaryotes". Proc. Biol. Sci. 268 (1466): 493–7. doi:10.1098/rspb.2000.1397. PMC 1088632. PMID 11296861.
- ↑ Galtier, N.; Lobry, J.R. (1997). "Relationships between genomic G+C content, RNA secondary structures, and optimal growth temperature in Prokaryotes". Journal of Molecular Evolution. 44 (6): 632–636. doi:10.1007/PL00006186. PMID 9169555.
- ↑ Zheng H, Wu H (December 2010). "Gene-centric association analysis for the correlation between the guanine-cytosine content levels and temperature range conditions of prokaryotic species". BMC Bioinformatics. 11: S7. doi:10.1186/1471-2105-11-S11-S7. PMC 3024870. PMID 21172057.
- ↑ Madigan,MT. and Martinko JM. (2003). Brock biology of microorganisms (10th ed.). Pearson-Prentice Hall. ISBN 84-205-3679-2.
- ↑ Definition of GC-ratio on Northwestern University, IL, USA
- ↑ Wilhelm J, Pingoud A, Hahn M (May 2003). "Real-time PCR-based method for the estimation of genome sizes". Nucleic Acids Res. 31 (10): e56. doi:10.1093/nar/gng056. PMC 156059. PMID 12736322.
- ↑ Vinogradov AE (May 1994). "Measurement by flow cytometry of genomic AT/GC ratio and genome size". Cytometry. 16 (1): 34–40. doi:10.1002/cyto.990160106. PMID 7518377.
- ↑ Bernardi G (January 2000). "Isochores and the evolutionary genomics of vertebrates". Gene. 241 (1): 3–17. doi:10.1016/S0378-1119(99)00485-0. PMID 10607893.
- ↑ Furey TS, Haussler D (May 2003). "Integration of the cytogenetic map with the draft human genome sequence". Hum. Mol. Genet. 12 (9): 1037–44. doi:10.1093/hmg/ddg113. PMID 12700172.
- ↑ Sumner AT, de la Torre J, Stuppia L (August 1993). "The distribution of genes on chromosomes: a cytological approach". J. Mol. Evol. 37 (2): 117–22. doi:10.1007/BF02407346. PMID 8411200.
- ↑ Aïssani B, Bernardi G (October 1991). "CpG islands, genes and isochores in the genomes of vertebrates". Gene. 106 (2): 185–95. doi:10.1016/0378-1119(91)90198-K. PMID 1937049.
- ↑ Pozzoli U, Menozzi G, Fumagalli M, et al. (2008). "Both selective and neutral processes drive GC content evolution in the human genome". BMC Evol. Biol. 8: 99. doi:10.1186/1471-2148-8-99. PMC 2292697. PMID 18371205.
- ↑ Wuitschick JD, Karrer KM (1999). "Analysis of genomic G + C content, codon usage, initiator codon context and translation termination sites in Tetrahymena thermophila". J. Eukaryot. Microbiol. 46 (3): 239–47. doi:10.1111/j.1550-7408.1999.tb05120.x. PMID 10377985.
- ↑ Birdsell JA (1 July 2002). "Integrating genomics, bioinformatics, and classical genetics to study the effects of recombination on genome evolution". Mol. Biol. Evol. 19 (7): 1181–97. doi:10.1093/oxfordjournals.molbev.a004176. PMID 12082137.
- ↑ Wayne LG; et al. (1987). "Report of the ad hoc committee on reconciliation of approaches to bacterial systematic". International Journal of Systematic Bacteriology. 37 (4): 463–4. doi:10.1099/00207713-37-4-463.
- ↑ Taxonomy browser on NCBI
- ↑ Whole genome data of "Streptomyces coelicolor" A3(2) on NCBI
- ↑ Whole genome data of Saccharomyces cerevisiae on NCBI
- ↑ Whole genome data of Arabidopsis thaliana on NCBI
- ↑ Whole genome data of Plasmodium falciparum on NCBI
- ↑ Musto H, Cacciò S, Rodríguez-Maseda H, Bernardi G (1997). "Compositional constraints in the extremely GC-poor genome of Plasmodium falciparum" (PDF). Mem. Inst. Oswaldo Cruz. 92 (6): 835–41. doi:10.1590/S0074-02761997000600020. PMID 9566216.
External links
- Table with GC-content of all sequenced prokaryotes
- Taxonomic browser of bacteria based on GC ratio on NCBI website.
- GC ratio in diverse species.