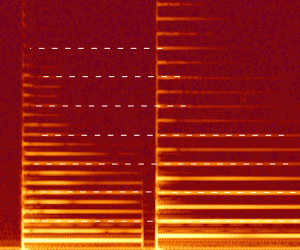
Formant
A formant, as defined by James Jeans,[1] is a harmonic of a note that is augmented by a resonance. The speech researcher Gunnar Fant[2] defines formants as "the spectral peaks of the sound spectrum |P(f)|". In acoustics generally, a very similar definition is widely used: the Acoustical Society of America defines a formant as: "a range of frequencies [of a complex sound] in which there is an absolute or relative maximum in the sound spectrum".[3] In speech science and phonetics, however, a formant is also sometimes used to mean an acoustic resonance[4] of the human vocal tract. Thus, in phonetics, formant can mean either a resonance or the spectral maximum that the resonance produces. Formants are often measured as amplitude peaks in the frequency spectrum of the sound, using a spectrogram (in the figure) or a spectrum analyzer and, in the case of the voice, this gives an estimate of the vocal tract resonances. In vowels spoken with a high fundamental frequency, as in a female or child voice, however, the frequency of the resonance may lie between the widely spaced harmonics and hence no corresponding peak is visible.
A room can be said to have formants characteristic of that particular room, due to the way sound reflects from its walls and objects. Room formants of this nature reinforce themselves by emphasizing specific frequencies and absorbing others, as exploited, for example, by Alvin Lucier in his piece I Am Sitting in a Room.
Formants and phonetics
| Vowel (IPA) |
Formant F1 (Hz) |
Formant F2 (Hz) |
Difference F2 – F1(Hz) |
|---|---|---|---|
| i | 240 | 2400 | 2160 |
| y | 235 | 2100 | 1865 |
| e | 390 | 2300 | 1910 |
| ø | 370 | 1900 | 1530 |
| ɛ | 610 | 1900 | 1290 |
| œ | 585 | 1710 | 1125 |
| a | 850 | 1610 | 760 |
| ɶ | 820 | 1530 | 710 |
| ɑ | 750 | 940 | 190 |
| ɒ | 700 | 760 | 60 |
| ʌ | 600 | 1170 | 570 |
| ɔ | 500 | 700 | 200 |
| ɤ | 460 | 1310 | 850 |
| o | 360 | 640 | 280 |
| o | 300 | 1390 | 1090 |
| u | 250 | 595 | 345 |
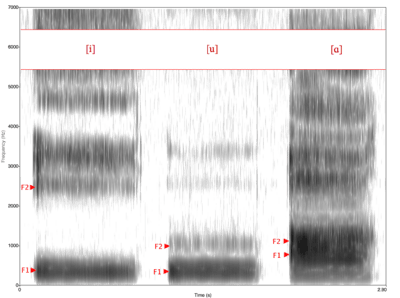
Formants are distinctive frequency components of the acoustic signal produced by speech or singing. The information that humans require to distinguish between speech sounds can be represented purely quantitatively by specifying peaks in the amplitude/frequency spectrum. Most of these formants are produced by tube and chamber resonance, but a few whistle tones derive from periodic collapse of Venturi effect low-pressure zones. The formant with the lowest frequency is called F1, the second F2, and the third F3. Most often the two first formants, F1 and F2, are enough to disambiguate the vowel. The relationship between the perceived vowel quality and the first two formant frequencies can be appreciated by listening to "artificial vowels" that are generated by passing a click train (to simulate the glottal pulse train) through a pair of bandpass filters (to simulate vocal tract resonances). An interactive demonstration of this can be found here.
Nasal consonants usually have an additional formant around 2500 Hz. The liquid [l] usually has an extra formant at 1500 Hz, whereas the English "r" sound ([ɹ]) is distinguished by a very low third formant (well below 2000 Hz).
Plosives (and, to some degree, fricatives) modify the placement of formants in the surrounding vowels. Bilabial sounds (such as /b/ and /p/ in "ball" or "sap") cause a lowering of the formants; velar sounds (/k/ and /ɡ/ in English) almost always show F2 and F3 coming together in a 'velar pinch' before the velar and separating from the same 'pinch' as the velar is released; alveolar sounds (English /t/ and /d/) cause less systematic changes in neighbouring vowel formants, depending partially on exactly which vowel is present. The time course of these changes in vowel formant frequencies are referred to as 'formant transitions'.
If the fundamental frequency of the underlying vibration is higher than a resonance frequency of the system, then the formant usually imparted by that resonance will be mostly lost. This is most apparent in the example of soprano opera singers, who sing high enough that their vowels become very hard to distinguish.
Control of resonances is an essential component of the vocal technique known as overtone singing, in which the performer sings a low fundamental tone, and creates sharp resonances to select upper harmonics, giving the impression of several tones being sung at once.
Spectrograms are used to visualise formants.
Formant plots
The first two formants are important in determining the quality of vowels, and are frequently said to correspond to the open/close and front/back dimensions (which have traditionally, though not entirely accurately, been associated with the shape and position of the tongue). Thus the first formant F1 has a higher frequency for an open vowel (such as [a]) and a lower frequency for a close vowel (such as [i] or [u]); and the second formant F2 has a higher frequency for a front vowel (such as [i]) and a lower frequency for a back vowel (such as [u]).[6][7] as can be seen in Fig. 1.
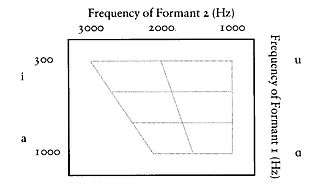
Vowels will almost always have four or more distinguishable formants; sometimes there are more than six. However, the first two formants are most important in determining vowel quality, and this is often displayed in terms of a plot of the first formant against the second formant,[8] though this is not sufficient to capture some aspects of vowel quality, such as rounding.[9] An example of how the vowels of a language or dialect may be plotted on a traditional auditory vowel chart and also on a formant plot may be seen in the case of Norwegian.
Many writers have addressed the problem of finding an optimal alignment of the positions of vowels on formant plots with those on the conventional vowel quadrilateral. The pioneering work of Ladefoged [10] used the Mel scale because this scale was claimed to correspond more closely to the auditory scale of pitch than to the acoustic measure of fundamental frequency expressed in Hertz as in Fig. 1. Two alternatives to the Mel scale are the Bark scale and the ERB-rate scale. A comparison of these three scales is shown by Hayward, p. 141, and formant plots based on the Hertz scale and on the Bark scale are compared on p. 153.[11] Another strategy for improving formant plots that has been widely adopted is to plot on the horizontal axis not the value of F2 but the difference between F1 and F2 for a given vowel.
Singer's formant
Studies of the frequency spectrum of trained singers, especially male singers, indicate a clear formant around 3000 Hz (between 2800 and 3400 Hz) that is absent in speech or in the spectra of untrained singers. It is thought to be associated with one or more of the higher resonances of the vocal tract.[12] It is this increase in energy at 3000 Hz which allows singers to be heard and understood over an orchestra. This formant is actively developed through vocal training, for instance through so-called voce di strega or "witch's voice"[13] exercises and is caused by a part of the vocal tract acting as a resonator.[14][15]
See also
References
- ↑ Jeans, J.H. (1938) Science & Music, reprinted by Dover, 1968.
- ↑ Fant, G. (1960). Acoustic Theory of Speech Production. Mouton & Co, The Hague, Netherlands.
- ↑ Standards Secretariat, Acoustical Society of America, (1994). ANSI S1.1-1994 (R2004) American National Standard Acoustical Terminology, (12.41) Acoustical Society of America, Melville, NY.
- ↑ Titze, I.R. (1994). Principles of Voice Production, Prentice Hall, ISBN 978-0-13-717893-3.
- ↑ Catford, J.C. (1988) A Practical Introduction to Phonetics, Oxford University Press, p. 161. ISBN 978-0198242178
- ↑ Ladefoged, Peter (2006) A Course in Phonetics (Fifth Edition), Boston, MA: Thomson Wadsworth, p. 188. ISBN 1-4130-2079-8
- ↑ Ladefoged, Peter (2001) Vowels and Consonants: An Introduction to the Sounds of Language, Maldern, MA: Blackwell, p. 40. ISBN 0-631-21412-7
- ↑ Deterding, David (1997) 'The Formants of Monophthong Vowels in Standard Southern British English Pronunciation', Journal of the International Phonetic Association, 27, pp. 47-55.
- ↑ Hayward, Katrina (2000) Experimental Phonetics, Harlow, UK: Pearson, p. 149. ISBN 0-582-29137-2
- ↑ Ladefoged, P. (1967). Three Areas of Experimental Phonetics. Oxford. p. 87.
- ↑ Hayward, K. (2000). Experimental Phonetics. Longman. ISBN 0-582-29137-2.
- ↑ Sundberg, J. (1974). "Articulatory interpretation of the ‘singing formant’", Journal of the Acoustical Society of America, 55, 838-844.
- ↑ Frisell, Anthony (2007). Baritone Voice. Boston: Branden Books. p. 84. ISBN 0-8283-2181-7.
- ↑ "Vocal Ring, or The Singer's Formant". The National Center for Voice and Speech. Retrieved 2008-04-07.
- ↑ Sundberg, Johan (1987). The science of the singing voice. DeKalb, Ill: Northern Illinois University Press. ISBN 0-87580-542-6.
External links
- Formants for fun and profit
- Formants and wah-wah pedals
- What is a formant? A discussion of the three different meanings of the word 'formant'
- Formant tuning by soprano singers from the University of New South Wales
- The acoustics of harmonic or overtone singing from the University of New South Wales
- Materials for measuring and plotting vowel formants
- Acoustics of the Vowel A discussion of possible formant variations without affection of the phoneme identity.
| Engineering | ||
|---|---|---|
| Psychoacoustics | ||
| Acousticians | ||
| Related topics | ||