Vernay, Switzerland
| Vernay | ||
|---|---|---|
|
Montbrelloz | ||
| ||
 Vernay | ||
|
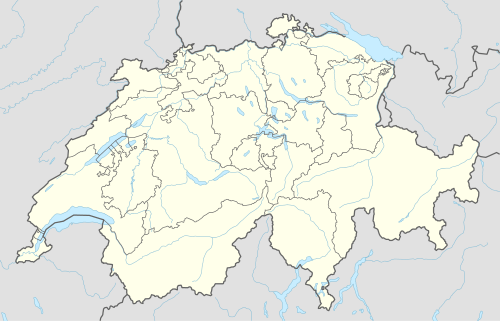
Location of Vernay  | ||
| Coordinates: 46°53′N 6°53′E / 46.883°N 6.883°ECoordinates: 46°53′N 6°53′E / 46.883°N 6.883°E | ||
| Country | Switzerland | |
| Canton | Fribourg | |
| District | Broye | |
| Government | ||
| • Mayor | Syndic | |
| Area[1] | ||
| • Total | 8.29 km2 (3.20 sq mi) | |
| Elevation | 465 m (1,526 ft) | |
| Population (Dec 2015[2]) | ||
| • Total | 1,119 | |
| • Density | 130/km2 (350/sq mi) | |
| Postal code | 1475 | |
| SFOS number | 2052 | |
| Localities | Autavaux, Forel, Montbrelloz | |
| Surrounded by | Bevaix (NE), Bussy, Chevroux (VD), Estavayer-le-Lac, Gorgier (NE), Grandcour (VD), Montbrelloz, Morens, Rueyres-les-Prés, Sévaz | |
| Website |
http://www.vernay-fr.ch SFSO statistics | |


Vernay is a municipality in the district of Broye, in the canton of Fribourg, Switzerland. It was created on 1 January 2006 from the merger of the municipalities of Autavaux, Forel and Montbrelloz.[3] The administrative seat is in Forel.
Geography
Vernay has an area, as of 2009, of 8.3 square kilometers (3.2 sq mi). Of this area, 6.2 km2 (2.4 sq mi) or 74.8% is used for agricultural purposes, while 1.51 km2 (0.58 sq mi) or 18.2% is forested. Of the rest of the land, 0.46 km2 (0.18 sq mi) or 5.5% is settled (buildings or roads), 0.02 km2 (4.9 acres) or 0.2% is either rivers or lakes and 0.16 km2 (0.062 sq mi) or 1.9% is unproductive land.[4]
Of the built up area, housing and buildings made up 3.7% and transportation infrastructure made up 1.6%. Out of the forested land, all of the forested land area is covered with heavy forests. Of the agricultural land, 64.2% is used for growing crops and 7.7% is pastures, while 2.9% is used for orchards or vine crops. All the water in the municipality is in lakes.[4]
Demographics
Vernay has a population (as of December 2015) of 1,119.[5] As of 2008, 6.4% of the population are resident foreign nationals.[6] Over the last 10 years (2000–2010) the population has changed at a rate of 25.3%. Migration accounted for 19%, while births and deaths accounted for 6.4%.[7]
Most of the population (as of 2000) speaks French (93.9%) as their first language, German is the second most common (4.2%) and Italian is the third (1.1%).[7]
As of 2008, the population was 50.6% male and 49.4% female. The population was made up of 483 Swiss men (47.7% of the population) and 30 (3.0%) non-Swiss men. There were 459 Swiss women (45.3%) and 41 (4.0%) non-Swiss women.[8]
The age distribution, as of 2000, in Vernay is; 149 children or 18.4% of the population are between 0 and 9 years old and 108 teenagers or 13.4% are between 10 and 19. Of the adult population, 76 people or 9.4% of the population are between 20 and 29 years old. 152 people or 18.8% are between 30 and 39, 114 people or 14.1% are between 40 and 49, and 91 people or 11.3% are between 50 and 59. The senior population distribution is 48 people or 5.9% of the population are between 60 and 69 years old, 49 people or 6.1% are between 70 and 79, there are 19 people or 2.4% who are between 80 and 89, and there are 2 people or 0.2% who are 90 and older.[8]
As of 2009, the construction rate of new housing units was 6.9 new units per 1000 residents.[7]
Politics
In the 2011 federal election the most popular party was the SP which received 22.8% of the vote. The next three most popular parties were the SVP (22.1%), the CVP (19.7%) and the FDP (15.2%).[9]
The SPS improved their position in Vernay rising to first, from fourth in 2007 (with 18.0%) The SVP moved from first in 2007 (with 27.0%) to second in 2011, the CVP moved from second in 2007 (with 25.6%) to third and the FDP moved from third in 2007 (with 18.9%) to fourth. A total of 345 votes were cast in this election, of which 2 or 0.6% were invalid.[10]
Economy
As of 2010, Vernay had an unemployment rate of 3.5%. As of 2008, there were 50 people employed in the primary economic sector and about 20 businesses involved in this sector. 51 people were employed in the secondary sector and there were 13 businesses in this sector. 29 people were employed in the tertiary sector, with 12 businesses in this sector.[7]
In 2008 the total number of full-time equivalent jobs was 105. The number of jobs in the primary sector was 37, all of which were in agriculture. The number of jobs in the secondary sector was 46 of which 12 or (26.1%) were in manufacturing and 35 (76.1%) were in construction. The number of jobs in the tertiary sector was 22. In the tertiary sector; 9 or 40.9% were in wholesale or retail sales or the repair of motor vehicles, 4 or 18.2% were in a hotel or restaurant, 1 was the insurance or financial industry, 1 was a technical professional or scientist, 7 or 31.8% were in education.[11]
Of the working population, 5.3% used public transportation to get to work, and 73.3% used a private car.[7]
Education
The Canton of Fribourg school system provides one year of non-obligatory Kindergarten, followed by six years of Primary school. This is followed by three years of obligatory lower Secondary school where the students are separated according to ability and aptitude. Following the lower Secondary students may attend a three or four year optional upper Secondary school. The upper Secondary school is divided into gymnasium (university preparatory) and vocational programs. After they finish the upper Secondary program, students may choose to attend a Tertiary school or continue their apprenticeship.[12]
During the 2010-11 school year, there were a total of 117 students attending 7 classes in Vernay. A total of 203 students from the municipality attended any school, either in the municipality or outside of it. There were 2 kindergarten classes with a total of 31 students in the municipality. The municipality had 5 primary classes and 86 students. During the same year, there were no lower secondary classes in the municipality, but 65 students attended lower secondary school in a neighboring municipality. There were no upper Secondary classes or vocational classes, but there were 2 upper Secondary students and 28 upper Secondary vocational students who attended classes in another municipality. The municipality had no non-university Tertiary classes, but there was one non-university Tertiary student and 5 specialized Tertiary students who attended classes in another municipality.[8]
References
- ↑ Arealstatistik Standard - Gemeindedaten nach 4 Hauptbereichen
- ↑ Swiss Federal Statistical Office - STAT-TAB, online database – Ständige und nichtständige Wohnbevölkerung nach institutionellen Gliederungen, Geburtsort und Staatsangehörigkeit (German) accessed 30 August 2016
- ↑ Amtliches Gemeindeverzeichnis der Schweiz published by the Swiss Federal Statistical Office (German) accessed 19 July 2011
- 1 2 Swiss Federal Statistical Office-Land Use Statistics 2009 data (German) accessed 25 March 2010
- ↑ Swiss Federal Statistical Office - STAT-TAB, online database – Ständige und nichtständige Wohnbevölkerung nach institutionellen Gliederungen, Geburtsort und Staatsangehörigkeit (German) accessed 30 August 2016
- ↑ Swiss Federal Statistical Office - Superweb database - Gemeinde Statistics 1981-2008 (German) accessed 19 June 2010
- 1 2 3 4 5 Swiss Federal Statistical Office accessed 15-November-2011
- 1 2 3 Canton of Fribourg Statistics (German) accessed 3 November 2011
- ↑ Canton of Fribourg National Council Election of 23 October 2011 Statistics (German) (French) accessed 3 November 2011
- ↑ Swiss Federal Statistical Office, Nationalratswahlen 2007: Stärke der Parteien und Wahlbeteiligung, nach Gemeinden/Bezirk/Canton (German) accessed 28 May 2010
- ↑ Swiss Federal Statistical Office STAT-TAB Betriebszählung: Arbeitsstätten nach Gemeinde und NOGA 2008 (Abschnitte), Sektoren 1-3 Archived December 25, 2014, at the Wayback Machine. (German) accessed 28 January 2011
- ↑ Chart of the education system in Canton Fribourg (German)