Fisher's noncentral hypergeometric distribution
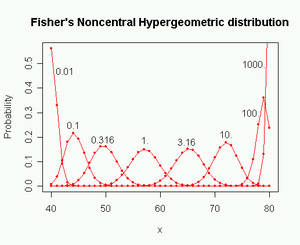
m1 = 80, m2 = 60, n = 100, ω = 0.01, ..., 1000
In probability theory and statistics, Fisher's noncentral hypergeometric distribution is a generalization of the hypergeometric distribution where sampling probabilities are modified by weight factors. It can also be defined as the conditional distribution of two or more binomially distributed variables dependent upon their fixed sum.
The distribution may be illustrated by the following urn model. Assume, for example, that an urn contains m1 red balls and m2 white balls, totalling N = m1 + m2 balls. Each red ball has the weight ω1 and each white ball has the weight ω2. We will say that the odds ratio is ω = ω1 / ω2. Now we are taking balls randomly in such a way that the probability of taking a particular ball is proportional to its weight, but independent of what happens to the other balls. The number of balls taken of a particular color follows the binomial distribution. If the total number n of balls taken is known then the conditional distribution of the number of taken red balls for given n is Fisher's noncentral hypergeometric distribution. To generate this distribution experimentally, we have to repeat the experiment until it happens to give n balls.
If we want to fix the value of n prior to the experiment then we have to take the balls one by one until we have n balls. The balls are therefore no longer independent. This gives a slightly different distribution known as Wallenius' noncentral hypergeometric distribution. It is far from obvious why these two distributions are different. See the entry for noncentral hypergeometric distributions for an explanation of the difference between these two distributions and a discussion of which distribution to use in various situations.
The two distributions are both equal to the (central) hypergeometric distribution when the odds ratio is 1.
Unfortunately, both distributions are known in the literature as "the" noncentral hypergeometric distribution. It is important to be specific about which distribution is meant when using this name.
Fisher's noncentral hypergeometric distribution was first given the name extended hypergeometric distribution (Harkness, 1965), and some authors still use this name today.
Univariate distribution
| Parameters |
|
|---|---|
| Support |
|
| pmf |
where |
| Mean | , where |
| Mode | , where , , . |
| Variance | , where Pk is given above. |


![x\in [x_{\min },x_{\max }]](../I/m/57488800b423152ed6ff673f52164ada934613ae.svg)


The probability function, mean and variance are given in the adjacent table.
An alternative expression of the distribution has both the number of balls taken of each color and the number of balls not taken as random variables, whereby the expression for the probability becomes symmetric.
The calculation time for the probability function can be high when the sum in P0 has many terms. The calculation time can be reduced by calculating the terms in the sum recursively relative to the term for y = x and ignoring negligible terms in the tails (Liao and Rosen, 2001).
The mean can be approximated by:
- ,

where , , .


The variance can be approximated by:
- .

Better approximations to the mean and variance are given by Levin (1984, 1990), McCullagh and Nelder (1989), Liao (1992), and Eisinga and Pelzer (2011). The saddlepoint methods to approximate the mean and the variance suggested Eisinga and Pelzer (2011) offer extremely accurate results.
Properties
The following symmetry relations apply:


Recurrence relation:

Recurrence relation
A Fisher hypergeometric distribution gives the distribution of the number of successes in independent draws from a population of size containing successes with the odds ratio .


Derivation
The univariate noncentral hypergeometric distribution may be derived alternatively as a conditional distribution in the context of two binomially distributed random variables, for example when considering the response to a particular treatment in two different groups of patients participating in a clinical trial. An important application of the noncentral hypergeometric distribution in this context is the computation of exact confidence intervals for the odds ratio comparing treatment response between the two groups.
Suppose X and Y are binomially distributed random variables counting the number of responders in two corresponding groups of size mX and mY respectively,
- .

Their odds ratio is given as
- .

The responder prevalence is fully defined in terms of the odds , , which correspond to the sampling bias in the urn scheme above, i.e.


- .

The trial can be summarized and analyzed in terms of the following contingency table.
Treatment Group | responder | non-responder | Total |
|---|---|---|---|
| X | x | . | mX |
| Y | y | . | mY |
| Total | n | . | N |
In the table, corresponds to the total number of responders across groups, and N to the total number of patients recruited into the trial. The dots denote corresponding frequency counts of no further relevance.

The sampling distribution of responders in group X conditional upon the trial outcome and prevalences, , is noncentral hypergeometric:


Note that the denominator is essentially just the numerator, summed over all events of the joint sample space for which it holds that . Terms independent of X can be factored out of the sum and cancel out with the numerator.


Multivariate distribution
| Parameters |
|
|---|---|
| Support | |
| pmf |
where |
| Mean |
The mean μi of xi can be approximated by where r is the unique positive solution to . |


The distribution can be expanded to any number of colors c of balls in the urn. The multivariate distribution is used when there are more than two colors.
The probability function and a simple approximation to the mean are given to the right. Better approximations to the mean and variance are given by McCullagh and Nelder (1989).
Properties
The order of the colors is arbitrary so that any colors can be swapped.
The weights can be arbitrarily scaled:
- for all


Colors with zero number (mi = 0) or zero weight (ωi = 0) can be omitted from the equations.
Colors with the same weight can be joined:

where is the (univariate, central) hypergeometric distribution probability.

Applications
Fisher's noncentral hypergeometric distribution is useful for models of biased sampling or biased selection where the individual items are sampled independently of each other with no competition. The bias or odds can be estimated from an experimental value of the mean. Use Wallenius' noncentral hypergeometric distribution instead if items are sampled one by one with competition.
Fisher's noncentral hypergeometric distribution is used mostly for tests in contingency tables where a conditional distribution for fixed margins is desired. This can be useful, for example, for testing or measuring the effect of a medicine. See McCullagh and Nelder (1989).
Software available
- FisherHypergeometricDistribution in Mathematica.
- An implementation for the R programming language is available as the package named BiasedUrn. Includes univariate and multivariate probability mass functions, distribution functions, quantiles, random variable generating functions, mean and variance.
- The R package MCMCpack includes the univariate probability mass function and random variable generating function.
- SAS System includes univariate probability mass function and distribution function.
- Implementation in C++ is available from www.agner.org.
- Calculation methods are described by Liao and Rosen (2001) and Fog (2008).
See also
- Noncentral hypergeometric distributions
- Wallenius' noncentral hypergeometric distribution
- Hypergeometric distribution
- Urn models
- Biased sample
- Bias
- Contingency table
- Fisher's exact test
References
Breslow, N. E.; Day, N. E. (1980), Statistical Methods in Cancer Research, Lyon: International Agency for Research on Cancer.
Eisinga, R.; Pelzer, B. (2011), "Saddlepoint approximations to the mean and variance of the extended hypergeometric distribution", Statistica Neerlandica, 65 (1), pp. 22–31, doi:10.1111/j.1467-9574.2010.00468.x.
Fog, A. (2007), Random number theory.
Fog, A. (2008), "Sampling Methods for Wallenius' and Fisher's Noncentral Hypergeometric Distributions", Communications in statictics, Simulation and Computation, 37 (2), pp. 241–257, doi:10.1080/03610910701790236.
Johnson, N. L.; Kemp, A. W.; Kotz, S. (2005), Univariate Discrete Distributions, Hoboken, New Jersey: Wiley and Sons.
Levin, B. (1984), "Simple Improvements on Cornfield's approximation to the mean of a noncentral Hypergeometric random variable", Biometrika, 71 (3), pp. 630–632, doi:10.1093/biomet/71.3.630.
Levin, B. (1990), "The saddlepoint correction in conditional logistic likelihood analysis", Biometrika, 77 (2), pp. 275–285, doi:10.1093/biomet/77.2.275, JSTOR 2336805.
Liao, J. (1992), "An Algorithm for the Mean and Variance of the Noncentral Hypergeometric Distribution", Biometrics, 48 (3), pp. 889–892, doi:10.2307/2532354, JSTOR 2532354.
Liao, J. G.; Rosen, O. (2001), "Fast and Stable Algorithms for Computing and Sampling from the Noncentral Hypergeometric Distribution", The American Statistician, 55 (4), pp. 366–369, doi:10.1198/000313001753272547.
McCullagh, P.; Nelder, J. A. (1989), Generalized Linear Models, 2. ed., London: Chapman and Hall.