Falmouth and Camborne (UK Parliament constituency)
Coordinates: 50°11′42″N 5°10′48″W / 50.195°N 5.180°W
| Falmouth and Camborne | |
|---|---|
|
Former County constituency for the House of Commons | |
|
Boundary of Falmouth and Camborne in Cornwall for the 2005 general election. | |
|
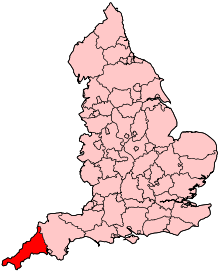
Location of Cornwall within England. | |
| County | Cornwall |
| Major settlements | Falmouth, Camborne, Redruth |
| 1950–2010 | |
| Number of members | One |
| Replaced by | Camborne and Redruth, Truro and Falmouth |
| Created from | Camborne, Penryn and Falmouth |

Falmouth and Camborne was, from 1950 until 2010, a county constituency represented in the House of Commons of the Parliament of the United Kingdom. It elected one Member of Parliament (MP) by the first past the post system of election.
History
The Falmouth and Camborne seat was created in 1950, succeeding the former Camborne constituency. The seat had an industrial tradition, mostly in tin mining. The seat alternated between the Labour and Conservative parties until 2005, when it was won by Julia Goldsworthy of the Liberal Democrats.
The former gold medal-winning athlete Sebastian Coe represented this seat as a Conservative from 1992 until his defeat by Labour in 1997.
Boundaries
1950-1983: The Municipal Boroughs of Falmouth and Penryn, the Urban District of Camborne-Redruth, and parts of the Rural Districts of Kerrier, Truro, and West Penwith.
1983-1997: The District of Kerrier wards of Camborne North, Camborne South, Camborne West, Constantine, Illogan North, Illogan South, Mabe and St Gluvias, Mawnan and Budock, Redruth North, Redruth South, St Day and Lanner, and Stithians, and the District of Carrick wards of Arwenack, Mylor, Penryn, Penwerris, Smithick, and Trevethan.
1997-2010: The District of Kerrier wards of Camborne North, Camborne South, Camborne West, Constantine and Gweek, Illogan North, Illogan South, Mabe and St Gluvias, Mawnan and Budock, Redruth North, Redruth South, St Day and Lanner, and Stithians, and the District of Carrick wards of Arwenack, Mylor, Penryn, Penwerris, Smithick, and Trevethan.
Boundary changes
Following its review of parliamentary representation in Cornwall, the Boundary Commission for England abolished this constituency at the 2010 general election. The new Camborne and Redruth seat took most of the electoral wards from this seat, while the remaining wards form part of the new Truro and Falmouth constituency.
Members of Parliament
| Election | Member[1] | Party | |
|---|---|---|---|
| 1950 | Harold Hayman | Labour | |
| 1966 | John Dunwoody | Labour | |
| 1970 | David Mudd | Conservative | |
| 1992 | Sebastian Coe | Conservative | |
| 1997 | Candy Atherton | Labour | |
| 2005 | Julia Goldsworthy | Liberal Democrat | |
| 2010 | constituency abolished: see Camborne and Redruth & Truro and Falmouth | ||
Elections
Elections in the 1950s
| Party | Candidate | Votes | % | ± | |
|---|---|---|---|---|---|
| Labour | Frank Harold Hayman | 18,988 | 43.16 | n/a | |
| Conservative | Peter Garnett Agnew | 16,997 | 38.63 | n/a | |
| Liberal | Gilbert Granville Sharp | 8,013 | 18.21 | n/a | |
| Majority | 1,991 | 4.53 | n/a | ||
| Turnout | 82.63 | ||||
| Labour win | |||||
| Party | Candidate | Votes | % | ± | |
|---|---|---|---|---|---|
| Labour | Frank Harold Hayman | 20,850 | 46.29 | ||
| Conservative | Nigel Nicolson | 19,847 | 44.07 | ||
| Liberal | Henry Stuart Townend | 4,343 | 9.64 | ||
| Majority | 1,003 | 2.23 | |||
| Turnout | 83.61 | ||||
| Labour hold | Swing | ||||
| Party | Candidate | Votes | % | ± | |
|---|---|---|---|---|---|
| Labour | Frank Harold Hayman | 21,587 | 51.24 | ||
| Conservative | Percy P. King | 20,540 | 48.76 | ||
| Majority | 1,047 | 2.49 | |||
| Turnout | 78.32 | ||||
| Labour hold | Swing | ||||
| Party | Candidate | Votes | % | ± | |
|---|---|---|---|---|---|
| Labour | Frank Harold Hayman | 20,083 | 45.79 | ||
| Conservative | Alison Margaret Tennant | 15,886 | 36.22 | ||
| Liberal | Norman Alan Stewart Gibson | 7,890 | 17.99 | ||
| Majority | 4,197 | 9.57 | |||
| Turnout | 81.58 | ||||
| Labour hold | Swing | ||||
Elections in the 1960s
| Party | Candidate | Votes | % | ± | |
|---|---|---|---|---|---|
| Labour | Frank Harold Hayman | 18,847 | 44.53 | ||
| Conservative | Robert Thomas Boscawen | 15,921 | 37.61 | ||
| Liberal | Edmund Henry Hambly | 7,559 | 17.86 | ||
| Majority | 2,926 | 6.91 | |||
| Turnout | 77.57 | ||||
| Labour hold | Swing | ||||
| Party | Candidate | Votes | % | ± | |
|---|---|---|---|---|---|
| Labour | John Elliot Orr Dunwoody | 21,394 | 46.85 | ||
| Conservative | Robert Thomas Boscawen | 18,131 | 39.70 | ||
| Liberal | Manuela Sykes | 6,144 | 13.45 | ||
| Majority | 3,263 | 7.14 | |||
| Turnout | 82.55 | ||||
| Labour hold | Swing | ||||
Elections in the 1970s
| Party | Candidate | Votes | % | ± | |
|---|---|---|---|---|---|
| Conservative | William David Mudd | 21,477 | 44.53 | ||
| Labour | John Elliot Orr Dunwoody | 19,954 | 41.37 | ||
| Liberal | Alfred George Sherman T Davey | 5,843 | 12.11 | ||
| Mebyon Kernow | Richard Jenkin | 960 | 1.99 | ||
| Majority | 1,523 | 3.16 | |||
| Turnout | 77.74 | ||||
| Conservative gain from Labour | Swing | ||||
| Party | Candidate | Votes | % | ± | |
|---|---|---|---|---|---|
| Conservative | William David Mudd | 22,500 | 41.87 | ||
| Labour | Michael George Dalling | 18,236 | 33.94 | ||
| Liberal | Alfred George Sherman T Davey | 13,000 | 24.19 | ||
| Majority | 4,264 | 7.94 | |||
| Turnout | 80.91 | ||||
| Conservative hold | Swing | ||||
| Party | Candidate | Votes | % | ± | |
|---|---|---|---|---|---|
| Conservative | William David Mudd | 23,950 | 47.22 | ||
| Labour | Michael George Dalling | 18,094 | 35.68 | ||
| Liberal | Edmund Thomas Sara | 6,428 | 12.67 | ||
| Independent Liberal | Alfred George Sherman T Davey | 2,246 | 4.43 | ||
| Majority | 5,856 | 11.55 | |||
| Turnout | 75.79 | ||||
| Conservative hold | Swing | ||||
| Party | Candidate | Votes | % | ± | |
|---|---|---|---|---|---|
| Conservative | William David Mudd | 30,523 | 56.68 | ||
| Labour | Peter M Tebbutt | 13,923 | 25.85 | ||
| Liberal | J Hall-Say | 7,489 | 13.91 | ||
| Mebyon Kernow | L Truran | 1,637 | 3.04 | ||
| National Front | M. Swingler | 280 | 0.52 | ||
| Majority | 16,600 | 30.83 | |||
| Turnout | 77.26 | ||||
| Conservative hold | Swing | ||||
Elections in the 1980s
| Party | Candidate | Votes | % | ± | |
|---|---|---|---|---|---|
| Conservative | William David Mudd | 24,614 | 50.00 | ||
| Social Democratic | D. Fieldsend | 13,589 | 27.60 | ||
| Labour | A. Bunt | 10,446 | 21.22 | ||
| Mebyon Kernow | Richard Jenkin | 582 | 1.18 | ||
| Majority | 11,025 | 22.39 | |||
| Turnout | 75.02 | ||||
| Conservative hold | Swing | ||||
| Party | Candidate | Votes | % | ± | |
|---|---|---|---|---|---|
| Conservative | William David Mudd | 23,725 | 43.89 | ||
| Social Democratic | Jonathan Clive Marks | 18,686 | 34.57 | ||
| Labour | John Digby Cosgrove | 11,271 | 20.85 | ||
| Monster Raving Loony | Frederick Allen Zapp | 373 | 0.69 | ||
| Majority | 5,039 | 9.32 | |||
| Turnout | 78.78 | ||||
| Conservative hold | Swing | ||||
Elections in the 1990s
| Party | Candidate | Votes | % | ± | |
|---|---|---|---|---|---|
| Conservative | Sebastian Newbold Coe | 21,150 | 36.9 | −7.0 | |
| Liberal Democrat | Terrye Lynn Jones | 17,883 | 31.2 | −3.4 | |
| Labour | John Digby Cosgrove | 16,732 | 29.2 | +8.3 | |
| Liberal | Paul T. Holmes | 730 | 1.3 | +1.3 | |
| Green | Kevin J. Saunders | 466 | 0.8 | +0.8 | |
| Monster Raving Loony | Frederick Allen Zapp | 327 | 0.6 | −0.1 | |
| Natural Law | Andrew J. Pringle | 56 | 0.1 | +0.1 | |
| Majority | 3,267 | 5.7 | −3.6 | ||
| Turnout | 57,344 | 81.1 | +2.3 | ||
| Conservative hold | Swing | −1.8 | |||
| Party | Candidate | Votes | % | ± | |
|---|---|---|---|---|---|
| Labour | Candice Kathleen Atherton | 18,151 | 33.8 | ||
| Conservative | Sebastian Newbold Coe | 15,463 | 28.8 | ||
| Liberal Democrat | Terrye Lynn Jones | 13,512 | 25.2 | ||
| Referendum | Peter John de Savary | 3,534 | 6.6 | ||
| Independent Labour | John Geach | 1,691 | 3.2 | ||
| Liberal | Paul T. Holmes | 527 | 1.0 | ||
| UKIP | Robert Smith | 355 | 0.7 | ||
| Mebyon Kernow | Ruth Lewarne | 238 | 0.4 | ||
| Monster Raving Loony | Gary Glitter | 161 | 0.3 | ||
| Majority | 2,688 | 5.0 | |||
| Turnout | 53,632 | 75.1 | |||
| Labour gain from Conservative | Swing | ||||
Elections in the 2000s
| Party | Candidate | Votes | % | ± | |
|---|---|---|---|---|---|
| Labour | Candice Kathleen Atherton | 18,532 | 39.6 | +5.7 | |
| Conservative | Nick Serpell | 14,005 | 29.9 | +1.1 | |
| Liberal Democrat | Julian Brazil | 11,453 | 24.5 | -0.7 | |
| UKIP | John Ernest Douglas Delavalette Browne | 1,328 | 2.8 | +2.2 | |
| Mebyon Kernow | Hilda Wasley | 853 | 1.8 | +1.4 | |
| Liberal | Paul T Holmes | 649 | 1.4 | +0.4 | |
| Majority | 4,527 | 9.7 | |||
| Turnout | 46,820 | 64.3 | -10.8 | ||
| Labour hold | Swing | ||||
| Party | Candidate | Votes | % | ± | |
|---|---|---|---|---|---|
| Liberal Democrat | Julia Anne Goldsworthy | 16,747 | 34.9 | +10.4 | |
| Labour | Candice Kathleen Atherton | 14,861 | 31.0 | -8.6 | |
| Conservative | Ashley Crossley | 12,644 | 26.3 | -3.6 | |
| UKIP | Michael Mahon | 1,820 | 3.8 | +1.0 | |
| Independent | William David Mudd | 961 | 2.0 | +2.0 | |
| Liberal | Paul T Holmes | 423 | 0.9 | -0.5 | |
| Mebyon Kernow | Hilda Wasley | 370 | 0.8 | -1.0 | |
| Veritas | Peter Gifford | 128 | 0.3 | +0.3 | |
| Removal Of Tetramasts In Cornwall | Richard Smith | 61 | 0.1 | +0.1 | |
| Majority | 1,886 | 3.9 | |||
| Turnout | 48,015 | 67.1 | 2.8 | ||
| Liberal Democrat gain from Labour | Swing | 9.5 | |||
References
- ↑ Leigh Rayment's Historical List of MPs – Constituencies beginning with "F"
- ↑ British parliamentary election results 1950-1973, Craig, F. W. S.
- ↑ British parliamentary election results 1950-1973, Craig, F. W. S.
- ↑ British parliamentary election results 1950-1973, Craig, F. W. S.
- ↑ British parliamentary election results 1950-1973, Craig, F. W. S.
- ↑ British parliamentary election results 1950-1973, Craig, F. W. S.
- ↑ British parliamentary election results 1950-1973, Craig, F. W. S.
- ↑ British parliamentary election results 1950-1973, Craig, F. W. S.
- ↑ British parliamentary election results 1974-1983, Craig, F. W. S.
- ↑ British parliamentary election results 1974-1983, Craig, F. W. S.
- ↑ British parliamentary election results 1974-1983, Craig, F. W. S.
- ↑ "Politics Resources". Election 1992. Politics Resources. 9 April 1992. Retrieved 6 Dec 2010.