Environmental impact of transport
The environmental impact of transport is significant because it is a major user of energy, and burns most of the world's petroleum. This creates air pollution, including nitrous oxides and particulates, and is a significant contributor to global warming through emission of carbon dioxide,[1] for sector.[2] By subsector, road transport is the largest contributor to global warming.[1]
Environmental regulations in developed countries have reduced the individual vehicles emission; however, this has been offset by an increase in the number of vehicles, and more use of each vehicle.[1] Some pathways to reduce the carbon emissions of road vehicles considerably have been studied.[3] Energy use and emissions vary largely between modes, causing environmentalists to call for a transition from air and road to rail and human-powered transport, and increase transport electrification and energy efficiency.
The transportation sector is a major source of greenhouse gas emissions (GHGs) in the United States. An estimated 30 percent of national GHGs are directly attributable to transportation—and in some regions the proportion is even higher. Transportation methods are the greatest contributing source of GHGs in the U.S., accounting for 47 percent of the net increase in total U.S. emissions since 1990.[4]
Other environmental impacts of transport systems include traffic congestion and automobile-oriented urban sprawl, which can consume natural habitat and agricultural lands. By reducing transportation emissions globally, it is predicted that there will be significant positive effects on Earth's air quality, acid rain, smog and climate change.[5]
The health impact of transport emissions is also of concern. A recent survey of the studies on the effect of traffic emissions on pregnancy outcomes has linked exposure to emissions to adverse effects on gestational duration and possibly also intrauterine growth.[6]
As listed above direct impacts such as noise and carbon monoxide emissions create direct and harmful effects on the environment, along with indirect impacts. The indirect impacts are often of higher consequence which lead to the misconception that it’s the opposite, since it is frequently understood that initial effects cause the most damage. For example, particulates which are the outcome of incomplete combustion done by an internal combustion engine, are not linked with respiratory and cardiovascular problems since they contribute to other factors not only to that specific condition. Even though the environmental impacts are usually listed individually there are also cumulative impacts. The synergetic consequences of transport activities. They take into account of the varied effects of direct and indirect impacts on an ecosystem. Climate change is the sum total impact of several natural and human made factors. 15% of global CO2 emissions are attributed to the transport sector.[7]
Sectors
Aviation
Aviation emissions vary based on length of flight. For covering long distances, longer flights are a better investment of the high energy costs of take-off and landing than very short flights, yet by nature of their length inevitably use much more energy. CO2 emissions from air travel range from .24 kg CO2 per passenger mile for short flights down to .18 kg CO2 per passenger mile for long flights.[8][9] Researchers have been raising concern about the globally increasing hypermobility of society, involving frequent and often long distance air travel and the resulting environmental and climate impacts. This threatens to overcome gains made in the efficiency of aircraft and their operations.[10] Climate scientist Kevin Anderson raised concern about the growing effect of air transport on the climate in a paper[13] and a presentation[14] in 2008. He has pointed out that even at a reduced annual rate of increase in UK passenger air travel and with the government's targeted emissions reductions in other energy use sectors, by 2030 aviation would be causing 70% of the UK's allowable CO2 emissions.
Road transport

Cars
Unleaded gasoline has 8.91 kg and diesel has 10.15 kg of CO2 per gallon.[11] CO2 emissions originating from ethanol are disregarded by international agreements however so gasoline containing 10% ethanol would only be considered to produce 8.02 kg of CO2 per gallon.[12] The average fuel economy for cars sold in the US 2005 was about 25.2 MPG giving around 0.35 kg of CO2 per mile.[13] The Department of Transportation's MOBILE 6.2 model, used by regional governments to model air quality, uses a fleet average (all cars, old and new) of 20.3 mpg giving around 0.44 kg of CO2 per mile.[14]
Buses
On average, inner city commuting buses emit 0.3 kg of CO2 per passenger mile (0.18 kg/km per passenger), and long distance (>20 mi, >32 km) bus trips emit 0.08 kg of CO2 per passenger mile (0.05 kg/km per passenger).[15] Road and transportation conditions vary, so some carbon calculations add 10% to the total distance of the trip to account for potential traffic jams, detours, and pit-stops that may arise.[8]
Rail
On average, commuter rail and subway trains emit 0.17 kg of CO2 per passenger mile (0.11 kg/km per passenger), and long distance (>20 mi, >32 km) trains emit 0.19 kg of CO2 per passenger mile (0.12 kg/km per passenger).[15] Some carbon calculations add 10% to the total trip distance to account for detours, stop-overs, and other issues that may arise.[8] Electric trains contributes relatively less to the pollution as pollution happens in the power plants which are lot more efficient than diesel driven engines.
Shipping
The fleet emission average for delivery vans, trucks and big rigs is 10.17 kg CO2 per gallon of diesel consumed. Delivery vans and trucks average about 7.8 mpg (or 1.3 kg of CO2 per mile) while big rigs average about 5.3 mpg (or 1.92 kg of CO2 per mile).[16]
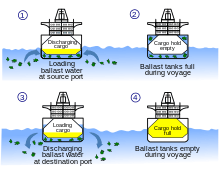
Discharges of sewage into our water bodies can come from many sources, including waste water treatment facilities, runoff from livestock operations, and vessels. These discharges have the potential to impair water quality, adversely affecting aquatic environments and increasing the risks to human health. While sewage discharges have potentially wide-ranging impacts on all aquatic environments, the impacts may be especially problematic in marinas, slow-moving rivers, lakes and other bodies of water with low-flushing rates. Environmentally this creates invasive species that often not drive other species to their extinction and cause harm to the environment and local businesses.[17]
Emissions from ships have a much more significant environmental impacts; many ships go internationally from port to port, are not seen for weeks contributing to air and water pollution on its voyage. Emission of greenhouse gases displaces the amount of gas that allows for UV-rays through the ozone. Sulfur and nitrogen compounds emitted from ship will oxidize in the atmosphere to form sulfate and nitrate. Emissions of nitrogen oxides, carbon monoxide, and volatile organic compounds (VOC) will lead to enhanced surface ozone formation and methane oxidation, depleting the ozone. The effect of the international ship emission on the distribution of chemical compounds like NOx, CO, O3, OH, SO2, HNO3, and sulfate is studied using a global chemical transport model (CTM), the Oslo CTM2. In particular, the large-scale distribution and diurnal variation of the oxidants and sulfur compounds are studied interactively. Meteorological data (winds, temperature, precipitation, clouds, etc.) used as input for the CTM calculations are provided by a weather prediction model.[18]
Shipping Emissions Factors:[19]
   - Air cargo - 0.8063 kg of CO2 per Ton-Mile
   - Truck - 0.1693 kg of CO2 per Ton-Mile
   - Train - 0.1048 kg of CO2 per Ton-Mile
   - Sea freight - 0.0403 kg of CO2 per Ton-Mile
   - Zeppelin - 0.0887 kg of CO2 per Ton-Mile
The road haulage industry is contributing around 20% of the UK’s total carbon emissions a year, with only the energy industry having a larger impact, at around 39%. Road haulage is a significant consumer of fossil fuels and associated carbon emissions - HGV vehicles account for almost 20 per cent of total emissions.[20]
Mitigation of environmental impact
Road-Rail Parallel Layout
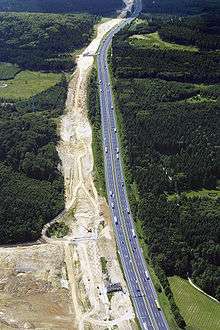
Road-Rail Parallel Layout is a design option to reduce the environmental impact of new transportation routes by locating railway tracks alongside a highway. In 1984 the Paris—Lyon high-speed rail route in France had about 14% parallel layout with the highway, and in 2002, 70% parallel layout was achieved with the Cologne–Frankfurt high-speed rail line.
When changing how we use the road systems and how they factor into the amount of pollution they contribute, using existing roads is key for changing the current layout of our road system. When deciding to construct mitigation work, steps should be taken to install permanent and temporary access roads as needed to support drilling/development and production phases of the project, but minimize the number and length of such roads. For drilling activities, using old or two-track road access rather than constructing a higher quality access road. Develop a traffic management plan for site access roads and for use of main public roads. Develop and implement measures to control off-highway vehicle traffic off of newly constructed access roads. Limit traffic to roads and portions of rights-of-way indicated specifically for the project. Instruct and require all personnel and contractors to adhere to speed limits to ensure safe and efficient traffic flow. Encourage project employees to carpool to work sites. Limit construction vehicle traffic on public roadways to off-peak commuting times to minimize impacts on local commuters. Restore roads to equal or better condition than before project construction after the heavy construction period is complete. Lastly Controlling dust along unsurfaced roads, especially near residences and farm fields may help prevent mixture of plants that can lead to disputes over patents.[21]
Involvement
Mitigation does not entirely involve large scale changes such as road construction, but everyday people can contribute. Walking, cycling trips, short or non-commute trips, can be an alternate mode of transportation when traveling short or even long distances. A multi-modal trip involving walking, a bus ride, and bicycling may be counted solely as a transit trip. Economic evaluations of transportation investments often ignore the true impacts of increased vehicular traffic—incremental parking, traffic accidents, and consumer costs—and the real benefits of alternative modes of transport. Most travel models do not account for the negative impacts of additional vehicular traffic that results from roadway capacity expansion, and overestimate the economic benefits of urban highway projects. Transportation planning indicators, such as average traffic speeds, congestion delays, and roadway level of service, measure mobility rather than accessibility.[22]
Australia
The environmental impact of transport in Australia is considerable. Australia subsidizes fossil fuel energy, keeping prices artificially low and raising greenhouse gas emissions due to the increased use of fossil fuels as a result of the subsidies. The Australian Energy Regulator and state agencies such as the New South Wales' Independent Pricing and Regulatory Tribunal set and regulate electricity prices, thereby lowering production and consumer cost.
See also
- Environmental effects of biodiesel
- Environmental impact of aviation
- List of environmental issues
- Vehicle recycling
References
- 1 2 3 Fuglestvet et al., Center for International Climate and Environmental Research (2007). "Climate forcing from the transport sectors" (PDF).
- ↑ Worldwatch Institute (16 January 2008). "Analysis: Nano Hypocrisy?".
- ↑ "Carbon Pathways Analysis – Informing Development of a Carbon Reduction Strategy for the Transport Sector - Claverton Group". claverton-energy.com.
- ↑ EPA,OAR,OAP,CPPD, US. "Climate and Energy Resources for State, Local, and Tribal Governments". www.epa.gov. Retrieved 2016-04-14.
- ↑ Environment Canada. "Transportation". Archived from the original on July 13, 2007. Retrieved 30 July 2008.
- ↑ Pereira, G. et al. (2010) “Residential exposure to traffic emissions and adverse pregnancy outcomes”. S.A.P.I.EN.S. 3 (1)
- ↑ Rodrigue, Dr. Jean-Paul. "The Environmental Impacts of Transportation". people.hofstra.edu. Retrieved 2016-04-14.
- 1 2 3 http://www.carbonfund.org/site/pages/carbon_calculators/category/Assumptions
- ↑ http://safeclimate.net/business/measuring/tools.php
- ↑ Gössling S, Ceron JP, Dubois G, Hall CM, Gössling IS, Upham P, Earthscan L (2009). Hypermobile travellers and Implications for Carbon Dioxide Emissions Reduction. In: Climate Change and Aviation: Issues, Challenges and Solutions, London. The chapter: (PDF)
- ↑ http://www.eia.doe.gov/oiaf/1605/coefficients.html
- ↑ "How much carbon dioxide is produced by burning gasoline and diesel fuel? - FAQ - U.S. Energy Information Administration (EIA)". eia.gov.
- ↑ http://www.nhtsa.dot.gov/staticfiles/DOT/NHTSA/Vehicle%20Safety/Articles/Associated%20Files/SummaryFuelEconomyPerformance-2005.pdf
- ↑ EPA,OAR,OTAQ, US. "Vehicles and Engines" (PDF). epa.gov.
- 1 2 http://docs.wri.org/wri_co2comm_2002_commuting_protected.xls
- ↑ http://www1.eere.energy.gov/vehiclesandfuels/pdfs/deer_2004/session6/2004_deer_kodjak.pdf
- ↑ EPA,OW,OWOW,OCPD, US. "Vessel Sewage Discharges: Homepage". www.epa.gov. Retrieved 2016-04-14.
- ↑ Endresen, Øyvind; Sørgård, Eirik; Sundet, Jostein K.; Dalsøren, Stig B.; Isaksen, Ivar S. A.; Berglen, Tore F.; Gravir, Gjermund (2003-09-16). "Emission from international sea transportation and environmental impact". Journal of Geophysical Research: Atmospheres. 108 (D17): 4560. doi:10.1029/2002JD002898. ISSN 2156-2202.
- ↑ "Klimakiller Flugverkehr - zur Umweltrelevanz des Flughafens Hamburg- Eine Information der Notgemeinschaft der Flughafenanlieger Hamburg". fluglaerm.de.
- ↑ "Reducing your Road Haulage Carbon Emissions - Return Loads". returnloads.net.
- ↑ "Transportation Mitigation Measures". teeic.indianaffairs.gov. Retrieved 2016-04-14.
- ↑ "Transportation Solutions | Reimagine!". www.reimaginerpe.org. Retrieved 2016-04-14.
External links
- Personal Transportation Factsheet by the University of Michigan's Center for Sustainable Systems
- John Schwartz (September 27, 2016). "An App to Help Save Emissions (and Maybe Money) When Buying a Car". NYT. Retrieved September 27, 2016.
- M.I.T. Carbon Counter app. "Cars evaluated against climate targets". carboncounter.com. carboncounter.com. Retrieved September 27, 2016.
| General |  | |
|---|---|---|
| Causes | ||
| Effects |
| |
| Mitigation | ||
| ||