Electricity sector in Germany
| Data | |
|---|---|
| Continuity of supply | 0.2815 hrs (16.89 min) interruption per subscriber per year |
| Installed capacity | 171.566 GW[1] |
| Share of fossil energy | 74.6% (2013)[2] |
| Share of renewable energy | 25.4% (2013)[2] |
| GHG emissions from electricity generation (2013) | 363.7 Mt CO2 [631.4 TWh × 576 g/kWh] |
| Average industrial tariff (US$/kW·h, 2013) | medium: 20.60[3] |
- Nuclear: 91.8 TWh (17.2%)
- Brown coal: 140.7 TWh (26.4%)
- Hard coal: 110.1 TWh (20.7%)
- Natural gas: 33.9 TWh (6.4%)
- Wind: 51.4 TWh (9.7%)
- Solar: 32.8 TWh (6.2%)
- Biomass: 53 TWh (10.0%)
- Hydro: 18.5 TWh (3.5%)
In 2014, the electricity sector in Germany was composed of 53% fossil, 17% nuclear and 30% renewable energy sources. Renewables increased their production by 6 TWh or 4% compared to 2013, and accounted for a total of 156 TWh or about 30% of net-generated electricity, despite the fact that hydroelectricity recorded a decrease in production due to unfavorable weather conditions.[4]
While nuclear power production decreased only slightly from 2014 to 2013, electricity generated from brown coal, hard coal, and gas-fired power plants significantly decreased by 3%, 9.5%, and 13.8%, respectively.[4] Germany will phase-out nuclear power by 2022.
Consumption
Germany produced power per person in 2008 equal to the EU-15 average (EU-15: 7,409 kWh/person) and 77% of the OECD average (8,991 kWh/person).[6]
The push toward renewables has come at a price. According to Forbes, the IEA reports that in 2015, German prices were 17.9 cents per kwh for industry, and 39.5 cents per kwh for residential customers, versus 7 and 12.5 cents respectively in the U.S. [7]
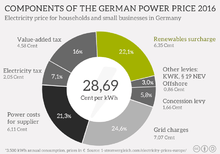
German households and small businesses pay the second highest electricity price in Europe for many years in a row now. In 2016 the unit price per kilowatt hour decreased slightly an average of 28,69 Cent. More than half of the power price consists of components determined by the state. These include charges for using power grids (24.6 %), levies for financing investment in renewable energy (22.1 %) and for other kinds of taxes (eg. GST 16%). [7]
Electricity trade in Germany
Germany, the largest exporter of electricity with 10% of the overall exports, reinforced its position as a net exporter by 20% during the year 2010[8]
Electricity per person and by power source
As of November 2014 Swedish authorities have not published "Electricity production by power source in different countries" after year 2009.
On 8 May 2016 renewables supplied 87.6% of Germany's national electricity consumption, albeit under extremely favourable weather conditions.[9]:11
| Electricity per person in Germany* (kWh/inhabitant)[6][10] | ||||||||||||
|---|---|---|---|---|---|---|---|---|---|---|---|---|
| Use | Production | Export | Exp. % | Fossil | Nuclear | Nuc. % | Other RE* | Bio+waste | Wind | Non RE use* | RE % | |
| 2004 | 7,445 | 7,476 | 32 | 0.4% | 4,603 | 2,025 | 27.2% | 654 | 194 | 6,597 | 11.4% | |
| 2005 | 7,468 | 7,523 | 55 | 0.7% | 4,674 | 1,977 | 26.5% | 670 | 201 | 6,597 | 11.7% | |
| 2006 | 7,528 | 7,727 | 199 | 2.6% | 4,796 | 1,706 | 22.7% | 856 | 369 | 6,303 | 16.3% | |
| 2008 | 7,450 | 7,693 | 243 | 3.3% | 4,635 | 1,804 | 24.2% | 873 | 381 | 6,196 | 16.8% | |
| 2009 | 7,051 | 7,200 | 149 | 2.1% | 4,314 | 1,644 | 23.3% | 288* | 491 | 461* | 5,811 | 17.6% |
| * This data for Germany is extracted from the international column of a Swedish report * Other RE is waterpower, solar and geothermal electricity and wind power until 2008 * Non RE use = use – production of renewable electricity * RE % = (production of RE / use) * 100% Note: European Union calculates the share of renewable energies in gross electrical consumption. | ||||||||||||
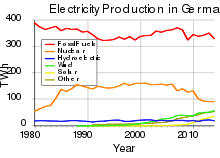
Mode of production


According to the IEA the gross production of electricity was 631 TWh in 2008 which gave the seventh position among the world top producers in 2010. The top seven countries produced 59% of electricity in 2008. The top producers were the United States (21.5%), China (17.1%), Japan (5.3%), Russia (5.1%), India (4.1%), Canada (3.2%) and Germany (3.1%).[11]
In 2015, Germany generated electricity from the following sources:[12]
- 24.0% Lignite
- 18.2% Hard coal
- 14.1% Nuclear
- 12.0% Onshore wind
- 8.8% Natural gas
- 6.8% Biomass
- 5.9% Solar
- 3.0% Hydro
- 1.3% Offshore wind
- 0.9% Waste
- 0.8% Oil
- 4.0% Other
Coal
In 2008, power generation from coal contributed 291 TWh or 46% to the overall production of 631 TWh. Germany remains one of the world's largest power producer from coal besides China (2,733 TWh), USA (2,133 TWh) and India (569 TWh).[11]
Nuclear power
Germany has defined a firm active phase-out policy of nuclear power. Eight nuclear power plants were permanently shut down after the Fukushima accident. All nuclear power plants are to be phased out by the end of 2022. According to BMU this is an opportunity for future generations.[13]
Siemens is the only significant nuclear constructor in Germany and the nuclear share was 3% of their business in 2000.[14] In 2006 the large international bribes of Siemens in the energy and telecommunication business were revealed. The case was investigated, for example, in Nigeria, the United States, Greece and South Korea.[15]
The installed nuclear power capacity in Germany was 20 GW in 2008 and 21 GW in 2004. The production of nuclear power was 148 TWh in 2008 (sixth top by 5.4% of world total) and 167 TWh in 2004 (fourth top by 6.1% of world total).[11][16]
In 2009 compared to 2004 the nuclear power was produced 19% less and its share had declined smoothly over time from 27% units to 23% units. The share of renewable electricity increased, substituting for nuclear power.[6]
Renewable electricity
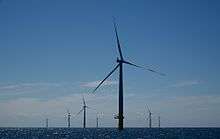
Germany's renewable energy sector is among the most innovative and successful worldwide. Net-generation from renewable energy sources in the German electricity sector has increased from 6.3% in 2000 to about 30% in 2014.[4] For the first time ever, wind, biogas, and solar combined accounted for a larger portion of net electricity production than brown coal in the first half of 2014.[17] While peak-generation from combined wind and solar reached a new all-time high of 74% in April 2014,[18] wind power saw its best day ever on 12 December 2014, generating 562 GWh.[19] Germany has been called "the world's first major renewable energy economy".[20][21]
Transmission network
Grid owners included, in 2008, RWE, EnBW, Vattenfall and E.ON. According to the European Commission the electricity producers should not own the electricity grid to ensure open competition. The European Commission accused E.ON of the misuse of markets in February 2008. Consequently, E.ON sold its share of the network.[22] As of July 2016 the four German TSOs are:
- 50Hertz Transmission GmbH (owned by Elia, formerly owned by Vattenfall)
- Amprion GmbH (RWE)
- Tennet TSO GmbH (owned by TenneT, formerly owned by E.ON)
- TransnetBW (renamed from EnBW Transportnetze AG and a 100% subsidiary of EnBW)
In Germany, there also exists a single-phase AC grid operated at 16.7 Hz to supply power to rail transport, see list of installations for 15kV AC railway electrification in Germany, Austria and Switzerland.
See also
| Wikimedia Commons has media related to Power plants in Germany. |
References
- ↑ http://www.ise.fraunhofer.de/de/downloads/pdf-files/data-nivc-/stromproduktion-aus-solar-und-windenergie-2014.pdf
- 1 2 http://www.bmwi-energiewende.de/EWD/Redaktion/Newsletter/2014/20/Meldung/infografik-aufwind-fuer-strom-aus-erneuerbaren.html
- ↑ http://www.bdew.de/internet.nsf/id/17DF3FA36BF264EBC1257B0A003EE8B8/$file/Foliensatz_Energie-Info-EE-und-das-EEG2013_31.01.2013.pdf
- 1 2 3 4 Electricity production from solar and wind in Germany in 2014 (German version) (PDF). Germany: Fraunhofer Institute. 5 January 2015. Retrieved 5 January 2015.
- ↑ U.S. Energy Information Administration International Energy Statistics - Electricity Generation, 2011
- 1 2 3 German numbers extracted from Energy in Sweden, Facts and figures, The Swedish Energy Agency, (in Swedish: Energiläget i siffror), Table: Specific electricity production per inhabitant with breakdown by power source (kWh/person), Source: IEA/OECD 2006 T23, 2007 T25, 2008 T26, 2009 T25 and 2010 T49.
- 1 2 "Electricity Prices in Europe - Who pays the most?". Stromvergleich (in German). Retrieved 2016-08-21.
- ↑ .Germany Power Market, Enerdata Yearbook Publication 2011
- ↑ WWF (September 2016). 15 signals: evidence the energy transition is underway (PDF). Paris, France: WWF France. Retrieved 2016-09-17.
- ↑ Energy in Sweden - facts and figures 2012 - Figures for 2009 Table 53: Electricity production by power source, 2009, in kWh/capita, page 59, 2012
- 1 2 3 IEA Key stats 2010 pages electricity 27 gas 13,25 fossil 25 nuclear 17
- ↑ "Germany is 20 years away from 100 percent renewable power – not!".
- ↑ The path to the energy of the future — safe, affordable and environmentally sound June 2011 BMU Germany
- ↑ Climate Change and Nuclear Power WWF pages 21, 22
- ↑ [Siemensin lahjusskandaali paisuu edelleen] yle 23.11.2006
- ↑ IEA Key energy statistics 2006
- ↑ "Bye-bye brown coal: Germany's new renewables mark - Business Spectator, July 10, 2014".
- ↑ thinkprogress.org, Sets New Record, Generating 74 Percent Of Power Needs From Renewable Energy, 13 May 2014
- ↑ RenewEconomy.com.au, Craig Morris, New wind power generation record in Germany, 16 December 2014
- ↑ Germany: The World's First Major Renewable Energy Economy
- ↑ Fraunhofer ISE, Electricity production from solar and wind in Germany – New record in wind power production, p.2, 15 December 2014
- ↑ Lehmänkaupat hämmentävät EU:n energianeuvotteluja, Helsingin Sanomat 1.3.2008 B11
External links
- Evans, Simon; Pearce, Rosamund (20 September 2016). "Mapped: how Germany generates its electricity". Carbon Brief. London, United Kingdom. Retrieved 2016-10-06.