Income in India

India's per capita income (nominal) was $1,497 in 2013, ranked at 120th out of 164 countries by the World Bank,[2] while its per capita income on purchasing power parity (PPP) basis was US$5,350, and ranked 106th.[3] Other estimates for per capita Gross National Income and Gross Domestic Product vary by source. For example, India's average GDP per capita on PPP basis in 2009, according to The Economist, was US$5,138, with significant variation among its states and union territories. Goa had the highest per capita PPP GDP at US$4903, while Bihar the lowest with per capita PPP GDP of US$682 as of 2015 [4] In rupee terms, India's Per capita income grew by 10.4% to reach Rs.74,920 in 2013-14.
While India's per capita incomes were low, the average household size and consequent household incomes were higher. India had a total of 247 million households in 2011, with an average of about 4.9 people per household, according to Census of India.[5]
Estimates for average household income and the size of India's middle income households vary by source. Using World Bank's definition of middle income families to be those with per capita income between $10 to $50 per day,[6] the National Council of Applied Economic Research[7] of India completed a survey and concluded there were 153 million people who belonged to middle income group in 2006. In contrast, Meyer and Birdsall and Tim Light used a different survey and estimated the number of Middle Income population to be about 70 million in 2009-2010.[8] These groups as well as the World Bank estimated in their 2011 reports that if India's economy continues to grow per projections, India's middle income group would double by 2015 over 2010 levels, and grow by an additional 500 million people by 2025. This would make it, with China, the world's largest middle income market.[9]
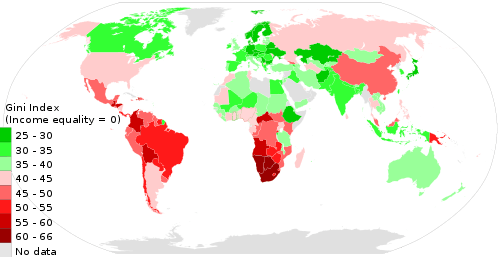
Compared to other countries, income inequality in India is relatively small as measured by Gini coefficient. India had a Gini coefficient of 32.5 in year 1999- 2000;[10] India's nominal Gini index rose to 36.8 in 2005, while real Gini after tax remained nearly flat at 32.6.[11]
States of India have significant disparities in their average income.[12] Bihar was by far the poorest in India, and per capita income was low in its neighbouring states, along with Uttar Pradesh, Jharkhand, Jammu & Kashmir, Assam, Manipur and Nagaland.[1] The higher income states include Goa, Delhi, Haryana, Sikkim, Maharashtra, Tamil Nadu, Gujarat and Kerala.[13][14][15]
States by GDP per capita
Andhra Pradesh, Karnataka, West Bengal, Haryana, Maharashtra, Kerala, Punjab, Gujarat and Tamil Nadu have a higher per capita GDP among larger states. Small Delhi and Goa top the list.
Rural-urban gap
Like in other countries, cities provide a better standard of living.
Towns and cities make more than two thirds of the Indian GDP, even though less than a third of the population live in them.[17]
India has a high rate of migration from rural areas to urban cities. A major reason for the massive migration to cities was the Partition of India. More than half of the refugees from Pakistan settled In urban areas such as Delhi.[18] It is estimated that up to 590 million people, or 40% of the Indian Population will be living in cities by 2030, much higher than the current 28%. Also, it is estimated that six states, including West Bengal, Tamil Nadu, Gujarat, Maharashtra, Karnataka, Kerala, Telangana and Punjab will have more than half of their total population living in Urban areas by 2030.[19]
In India, urban areas have seen a much higher growth rate as compared to rural areas. Despite up to three-fourths of the population living in rural areas, rural areas contribute to only one-third of the national income.The main reason for rural India's poor performance in terms of income is the fact that rural India is mostly dependent on agriculture. The agriculture sector in India grew at a rate of only 1.6% in 2008-09,[20] while the Indian Economy grew at a rate of 6.7%, despite the 2008 Financial Crisis.[21] An extremely slow rate of growth in the agriculture sector of the Indian economy has serious implications for the rural-urban divide, both in terms of income and GDP. Some estimates say that the average income of a person living in an urban area may be up to 4 times higher than that of a person living in a rural area.[22] The rising levels of urbanisation in India is a major reason for the rising levels of income disparity in the country.
Bridging the Urban-Rural Gap
In India, the government has taken steps to bridge the urban-rural gap. This includes setting up the Council for Advancement of People's Action and Rural Technology (CAPART) by the Ministry of Rural Development.[23] CAPART helps in providing assistance to various organisations which help in developmental activities.[24] There is a constantly widening rift between rural and urban India, not only in terms of income, but other social measures. There is an urgent need to strengthen the agriculture sector in India, bring about reforms in labour laws, and provide education.[25]
The Economic Survey of India 2007 by OECD concluded
At the state level, economic performance is much better in states with a relatively liberal regulatory environment than in the relatively more restrictive states".[17]
The analysis of this report suggests that the differences in economic performance across states are associated with the extent to which states have introduced market-oriented reforms. Thus, further reforms on these lines, complemented with measures to improve infrastructure, education and basic services, would increase the potential for growth outside of agriculture and thus boost better-paid employment, which is a key to sharing the fruits of growth and lowering poverty.[17]
About 27.5% of the population was living below the poverty line in 2004-2005.[26]
Reforming cumbersome regulatory procedures, improving rural connectivity, establishing law and order, creating a stable platform for natural resource investment that balances business interests with social concerns, and providing rural finance are important.— World Bank: India Country Overview 2008[27]
See also
References
- 1 2 Comparing Indian states and territories, CEIC, The Economist, (June 2011).
- ↑ "GNI per capita, Atlas method (current US$)". World Bank. 2014-05-01. Retrieved 2014-07-16.
- ↑ "GNI per capita, PPP (current international $)". World Bank. 2014-05-01. Retrieved 2014-07-16.
- ↑ Per capita of Indian states
- ↑ Households data for India Census of India 2011, Govt of India (2013)
- ↑ Kharas, H. (2010). The Emerging Middle Class In Developing Countries. Working Paper 285, OECD Development Center, Paris
- ↑ National Survey of Household Income and Expenditure (NSHIE)/Market Information Survey of Households (MISH) NCAER India (2013)
- ↑ Meyer and Birdsall, New Estimates of India’s Middle Class Center for Global Development (2012)
- ↑ Kharas, The Emerging Middle Class in Developing Countries Brookings Institution (World Bank Conference, 2011)
- ↑ "Fact Sheet: Gini Coefficient" (PDF). Source: The World Bank (2004) and Census and Statistics Department (2002). Legislative Council Secretariat Hong Kong. Retrieved 2007-08-01.
Note: The Gini coefficient in this datasheet is calculated on a scale of 0 to 1 and not 0 to 100. Hence, on a scale of 100 India's Gini coefficient (1999-2000) was 32.5 rather than 3.25
- ↑ Gehring, Keith; Kulkarni, Kishore G (2008). "Economic growth and income inequality in India". Journal of Management. 6 (2): 1–15.
- ↑ Datt, Ruddar; Sundharam, K.P.M. "27". Indian Economy. pp. 471–472.
- ↑ "Development Policy Review". World Bank.
- ↑ Sachs, D. Jeffrey; Bajpai, Nirupam; Ramiah, Ananthi (2002). "Understanding Regional Economic Growth in India" (PDF). Working paper 88. Archived from the original (PDF) on 2007-07-01.
- ↑ Kurian, N.J. "Regional disparities in india". Retrieved 2005-08-06.
- ↑ Table 2.9 of World Development Indicators: Distribution of income or consumption The World Bank (2014)
- 1 2 3 "Economic survey of India 2007: Policy Brief" (PDF). OECD. Archived from the original (PDF) on 6 June 2011.
- ↑ "The Rural-Urban Divide in India".
- ↑ "Urban India 2030".
- ↑ "Agriculture Growth Rate".
- ↑ "India's Growth rate in 2008".
- ↑ "The Great Indian Divide".
- ↑ "Bridging The Divide".
- ↑ "CAPART organization".
- ↑ "Measures to Bridge the Gap".
- ↑ Poverty estimates for 2004-05, Planning commission, Government of India, March 2007.
- ↑ "India Country Overview 2008". World Bank. 2008.
| Companies |
|
|---|---|
| Governance |
|
| Currency | |
| Financial services | |
| History | |
| People |
|
| States | |
| Sectors | |
| |