Demographics of Swaziland
This article is about the demographic features of the population of Swaziland, including population density, ethnicity, education level, health of the populace, economic status, religious affiliations and other aspects of the population.
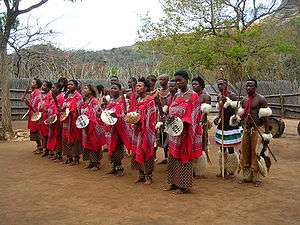
The majority of Swaziland's population is ethnic Swazi, mixed with a small number of Zulus and white Africans, predominantly of British and Afrikaner origin. This population also includes a small segment within it that is mixed with any number of these ancestries.
Traditionally Swazis have been subsistence farmers and herders, but most now work in the growing urban formal economy and in government. Some Swazis work in the mines in South Africa. Swaziland also received Portuguese settlers and black refugees from Mozambique. Christianity in Swaziland is sometimes mixed with traditional beliefs and practices. Most Swazis ascribe a special spiritual role to the Swazi Royal Family.
The country's official languages are Siswati (a language related to Zulu) and English. Government and commercial business is conducted mainly in English. Asians, Afrikaners, Portuguese, and black Mozambicans speak their own languages.
Population
Swaziland's population is 1,419,623 according to the 2014 estimate from the CIA Factbook. The 2007 Census put the nation's population at 912,229. This number is lower than the 1997 Census, which gave 929,718 residents. The small difference is believed to be the result of massive emigration of Swazis to South Africa in search of work.[1]
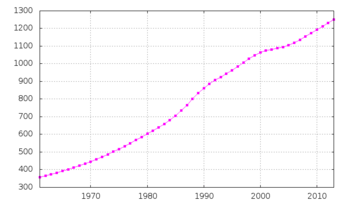
According to the 2010 revision of the World Population Prospects the total population was 1 186 000 in 2010, compared to only 273 000 in 1950. The proportion of children below the age of 15 in 2010 was 38.4%, 58.2% was between 15 and 65 years of age, while 3.4% was 65 years or older .[2]
| Total population (x 1000) | Population aged 0–14 (%) | Population aged 15–64 (%) | Population aged 65+ (%) | |
|---|---|---|---|---|
| 1950 | 273 | 43.0 | 54.3 | 2.7 |
| 1955 | 307 | 44.2 | 53 | 2.8 |
| 1960 | 349 | 45.2 | 52 | 2.8 |
| 1965 | 392 | 46.3 | 51.0 | 2.7 |
| 1970 | 446 | 47.2 | 50.1 | 2.7 |
| 1975 | 517 | 48.0 | 49.3 | 2.7 |
| 1980 | 603 | 48.8 | 48.5 | 2.7 |
| 1985 | 706 | 48.9 | 48.3 | 2.8 |
| 1990 | 863 | 48.1 | 49.2 | 2.7 |
| 1995 | 964 | 47.6 | 49.6 | 2.8 |
| 2000 | 1 064 | 44.6 | 52.4 | 3.0 |
| 2005 | 1 105 | 41.8 | 55 | 3.2 |
| 2010 | 1 186 | 38.4 | 58.2 | 3.4 |
Vital statistics
Registration of vital events is in Swaziland not complete. The Population Departement of the United Nations prepared the following estimates. [2]
| Period | Live births per year | Deaths per year | Natural change per year | CBR* | CDR* | NC* | TFR* | IMR* |
|---|---|---|---|---|---|---|---|---|
| 1950-1955 | 14 000 | 7 000 | 7 000 | 48.1 | 22.6 | 25.5 | 6.70 | 174 |
| 1955-1960 | 16 000 | 7 000 | 9 000 | 47.6 | 20.8 | 26.8 | 6.70 | 160 |
| 1960-1965 | 18 000 | 7 000 | 10 000 | 47.9 | 19.6 | 28.2 | 6.75 | 150 |
| 1965-1970 | 20 000 | 8 000 | 13 000 | 49.0 | 18.5 | 30.4 | 6.85 | 141 |
| 1970-1975 | 24 000 | 8 000 | 16 000 | 49.3 | 16.4 | 32.9 | 6.87 | 124 |
| 1975-1980 | 27 000 | 8 000 | 19 000 | 48.5 | 14.2 | 34.2 | 6.73 | 108 |
| 1980-1985 | 31 000 | 8 000 | 23 000 | 47.7 | 12.0 | 35.7 | 6.54 | 90 |
| 1985-1990 | 36 000 | 8 000 | 28 000 | 46.1 | 10.3 | 35.8 | 6.13 | 77 |
| 1990-1995 | 36 000 | 9 000 | 28 000 | 39.9 | 9.4 | 30.4 | 5.30 | 69 |
| 1995-2000 | 35 000 | 12 000 | 22 000 | 34.1 | 11.9 | 22.1 | 4.49 | 80 |
| 2000-2005 | 34 000 | 17 000 | 17 000 | 31.8 | 15.7 | 16.1 | 4.01 | 87 |
| 2005-2010 | 34 000 | 17 000 | 17 000 | 30.1 | 14.9 | 15.2 | 3.57 | 76 |
| * CBR = crude birth rate (per 1000); CDR = crude death rate (per 1000); NC = natural change (per 1000); IMR = infant mortality rate per 1000 births; TFR = total fertility rate (number of children per woman) | ||||||||
Fertility and Births
Total Fertility Rate (TFR) (Wanted Fertility Rate) and Crude Birth Rate (CBR):[3]
| Year | CBR (Total) | TFR (Total) | CBR (Urban) | TFR (Urban) | CBR (Rural) | TFR (Rural) |
|---|---|---|---|---|---|---|
| 1986 | 6,4 | |||||
| 1991 | 5,6 | |||||
| 1997 | 4,5 | |||||
| 1999-2002 | 4,2 | |||||
| 2006-2007 | 31,1 | 3,8 (2,1) | 31,9 | 3,0 (1,8) | 31,0 | 4,2 (2,2) |
CIA World Factbook demographic statistics
The following demographic statistics are from the CIA World Factbook, unless otherwise indicated.
Population
1,419,623 (July 2014 est.)[4]
note:
Estimates for this country explicitly take into account the effects of excess mortality due to AIDS; this can result in lower life expectancy, higher infant mortality and death rates, lower population and growth rates, and changes in the distribution of population by age and sex than would otherwise be expected.
Median age
total: 20.5 years male: 20.2 years female: 20.9 years (2012 est.)
Sex ratio
- at birth: 1.02 male(s)/female (2003 est.), 1.03 male(s)/female (2000 est.)
- under 15 years: 0.99 male(s)/female (2003, 2000 est.)
- 15-64 years: 0.99 (2003 est.), 0.93 male(s)/female (2000 est.)
- 65 years and over: 0.78 (2003 est.), 0.7 male(s)/female (2000 est.)
- total population: 0.99 (2003 est.), 0.95 male(s)/female (2000 est.)
Population growth rate
1.195% (2012 est.)
Birth rate
26.16 births/1,000 population (2012 est.)
Death rate
14.21 deaths/1,000 population (2012 est.)
Net migration rate
0 migrants/1,000 population (2010)
Urbanization
- urban population: 21% of total population (2010)
- rate of urbanization: 1.5% annual rate of change (2010-15 est.)
Maternal mortality rate
320 deaths/100,000 live births (2010)
Infant mortality rate
- total: 59.57 deaths/1,000 live births
- male: 63.59 deaths/1,000 live births
- female: 55.44 deaths/1,000 live births (2012 est.)
Life expectancy at birth
total population:
- 49.06 years (2012 est.)
- 47.85 years (2010 est.)
- 33.22 (2005 est.)
- 39.47 (2003 est.)
Total fertility rate
3.03 children born/woman (2012 est.)
Health expenditures
6.3% of GDP (2009)
Physicians density
0.16 physicians/1,000 population (2004)
Hospital bed density
2.1 beds/1,000 population (2006)
HIV/AIDS
- adult prevalence rate 25.9% (2009 est.) [5]
people living with HIV/AIDS 180,000 (2009 est.) [5]
deaths 7,000 (2009 est.)[4]
Major infectious diseases
- degree of risk: high
- food or waterborne diseases: bacterial diarrhea, hepatitis A, and typhoid :fever
- vectorborne disease: malaria
- water contact disease: schistosomiasis (2009)
Nationality
noun: Swazi(s) adjective: Swazi
Ethnic groups[4]
Religions[4]
- Zionist 40% (a blend of Christianity and Indigenous ancestral worship)
- Roman Catholic 20%
- Islam 10%
- Other 30% (includes Anglican, Baha'i, Methodist, Mormon, Jewish)
Languages[4]
Literacy
- definition: age 15 and over can read and write
- total population: 81.6% (2003 est.), 76.7% (1995 est.)
- male: 82.6% (2003 est.), 78% (1995 est.)
- female: 80.8% (2003 est.), 75.6% (1995 est.)
See also
Notes
| Wikimedia Commons has media related to Demographics of Swaziland. |
- ↑ Nolen, Stephanie (2009-04-03). "Where have all the Swazis gone?". The Globe and Mail. Archived from the original on December 26, 2015. Retrieved 2015-12-26.
- 1 2 Population Division of the Department of Economic and Social Affairs of the United Nations Secretariat, World Population Prospects: The 2010 Revision
- ↑ http://www.safaids.net/files/Swaziland%20Demographic%20and%20Health%20Survey%202006-2007.pdf
- 1 2 3 4 5 "Africa :: SWAZILAND". CIA The World Factbook.
- 1 2 Swaziland statistics: HIV prevalence rate 2007 ages 15-49, UNICEF