Dartford (UK Parliament constituency)
| Dartford | |
|---|---|
|
County constituency for the House of Commons | |
|
Boundary of Dartford in Kent. | |
|
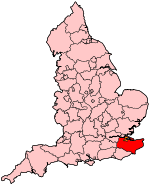
Location of Kent within England. | |
| County | Kent |
| Electorate | 74,756 (December 2010)[1] |
| Major settlements | Dartford |
| Current constituency | |
| Created | 1885 |
| Member of parliament | Gareth Johnson (Conservative) |
| Number of members | One |
| Created from | West Kent |
| Overlaps | |
| European Parliament constituency | South East England |

Dartford is a constituency[n 1] represented in the House of Commons of the UK Parliament since 2010 by Gareth Johnson of the Conservative Party.[n 2] The constituency is currently the longest serving 'bellwether' constituency in the UK Parliament as the party of the winning candidate has gone on to form the government in every General Election since 1964.[2]
History
The seat was created under the Redistribution of Seats Act 1885. This Act added a net 18 seats, but its main purpose was to correct the over-representation of minor, often still old boroughs and depopulated county divisions. In their place were created new seats with a larger population. In Kent the Act finally abolished the Sandwich constituency, which sent two MPs until 1885. It also halved the representation of no fewer than four other historic towns. In contrast a seat for Dartford, the North-Western Division of Kent or North West Kent, was created.
- Political history
In the early 20th century, the Dartford constituency was very much a bellwether: Dartford's results later shifted towards the left: in 1938 and then in 1951 (as well as the two intervening general elections) a Labour MP was elected, on those two occasions in opposition.
This was the first seat contested by Margaret Thatcher (then Margaret Roberts), at the 1950 and 1951 general elections. From 1945 until 2010, Dartford has been a Labour-Conservative marginal seat and thus a "bellwether" again: since 1964 the party winning the seat has gone on to form the government.
Boundaries
1885-1918: The Sessional Division of Dartford, the Parliamentary Boroughs of Greenwich and Woolwich, and part of the Sessional Division of Bromley.
1918-1945: The Urban Districts of Bexley, Dartford, and Erith, and in the Rural District of Dartford the civil parishes of Crayford, Stone, and Swanscombe.
1945-1955: The Municipal Boroughs of Dartford and Erith, and the Urban District of Crayford.
1955-1974: The Municipal Borough of Dartford, the Urban District of Swanscombe, and the Rural District of Dartford.
1974-1983: The Municipal Borough of Dartford, the Urban District of Swanscombe, and in the Rural District of Dartford the civil parishes of Darenth, Southfleet, Stone, Sutton-at-Hone, and Wilmington.
1983-1997: The Borough of Dartford, and the District of Sevenoaks wards of Ash-cum-Ridley, Fawkham and Hartley, Horton Kirby, and Longfield.
1997-2010: The Borough of Dartford, and the District of Sevenoaks wards of Fawkham and Hartley, and Horton Kirby.
2010–present: The Borough of Dartford, and the District of Sevenoaks ward of Hartley and Hodsoll Street.
Constituency profile
As its name suggests, the main settlement in the constituency is the town of Dartford, but it also includes a number of other towns and villages, including Swanscombe, Longfield, Greenhithe and Wilmington. These all add up to create a diverse constituency which covers urban and rural areas.
The population of the constituency currently stands at around 90,000, around 8,000 of whom live in the borough of Sevenoaks, with the remainder living in the borough of Dartford. The constituency is on the border with the London Borough of Bexley, with which at one time it shared an MP.
Workless claimants who were registered jobseekers were in November 2012 lower than the national average of 3.8%, at 2.9% of the population based on a statistical compilation by The Guardian.[3]
Members of Parliament
Elections
Elections in the 2010s
| Party | Candidate | Votes | % | ± | |
|---|---|---|---|---|---|
| Conservative | Gareth Johnson[7] | 25,670 | 49.0 | +0.2 | |
| Labour | Simon Thomson[7] | 13,325 | 25.4 | -2.1 | |
| UKIP | Elizabeth Jones | 10,434 | 19.9 | +16.2 | |
| Liberal Democrat | Simon Beard[8] | 1,454 | 2.8 | -11.9 | |
| Green | Andy Blatchford | 1,324 | 2.5 | N/A | |
| English Democrat | Steve Uncles | 211 | 0.4 | -3.9 | |
| Majority | 12,345 | 23.6 | +2.4 | ||
| Turnout | 52,418 | 68.4 | +2.7 | ||
| Conservative hold | Swing | +1.2 | |||
| Party | Candidate | Votes | % | ± | |
|---|---|---|---|---|---|
| Conservative | Gareth Johnson | 24,428 | 48.8 | +7.6 | |
| Labour | John Adams | 13,800 | 27.6 | −15.5 | |
| Liberal Democrat | James Willis | 7,361 | 14.7 | +4.6 | |
| English Democrat | Gary Rogers | 2,178 | 4.3 | +4.3 | |
| UKIP | Richard Palmer | 1,842 | 3.7 | +0.7 | |
| Independent | Stephane Tindame | 264 | 0.5 | +0.5 | |
| Fancy Dress Party | Ernie Crockford | 207 | 0.4 | +0.7 | |
| Majority | 10,628 | 21.2 | |||
| Turnout | 50,080 | 65.7 | +2.4 | ||
| Conservative gain from Labour | Swing | 11.6 | |||
Elections in the 2000s
| Party | Candidate | Votes | % | ± | |
|---|---|---|---|---|---|
| Labour | Howard Stoate | 19,909 | 42.6 | −5.4 | |
| Conservative | Gareth Johnson | 19,203 | 41.1 | +0.5 | |
| Liberal Democrat | Peter Bucklitsch | 5,036 | 10.8 | +2.3 | |
| UKIP | Mark Croucher | 1,407 | 3.0 | +0.8 | |
| New England | Michael Tibby | 1,224 | 2.6 | +2.6 | |
| Majority | 706 | 1.5 | |||
| Turnout | 46,779 | 63.2 | 1.3 | ||
| Labour hold | Swing | −2.9 | |||
| Party | Candidate | Votes | % | ± | |
|---|---|---|---|---|---|
| Labour | Howard Stoate | 21,466 | 48.0 | -0.6 | |
| Conservative | Bob Dunn | 18,160 | 40.6 | +0.3 | |
| Liberal Democrat | Graham Morgan | 3,781 | 8.5 | -0.9 | |
| UKIP | Mark Croucher | 989 | 2.2 | N/A | |
| Fancy Dress Party | Keith Davenport | 344 | 0.8 | +0.3 | |
| Majority | 3,306 | 7.4 | |||
| Turnout | 44,740 | 61.9 | -12.7 | ||
| Labour hold | Swing | ||||
Elections in the 1990s
| Party | Candidate | Votes | % | ± | |
|---|---|---|---|---|---|
| Labour | Howard Stoate | 25,278 | 48.6 | +12.4 | |
| Conservative | Bob Dunn | 20,950 | 40.3 | -10.6 | |
| Liberal Democrat | Dorothy Webb | 4,872 | 9.4 | -2.8 | |
| BNP | Paul McHale | 424 | 0.8 | N/A | |
| Fancy Dress Party | Peter Homden | 287 | 0.5 | +0.1 | |
| Christian Democrat | James Pollitt | 228 | 0.4 | N/A | |
| Majority | 4,328 | 8.3 | |||
| Turnout | 52,039 | 74.6 | |||
| Labour gain from Conservative | Swing | ||||
| Party | Candidate | Votes | % | ± | |
|---|---|---|---|---|---|
| Conservative | Bob Dunn | 31,194 | 51.9 | −1.6 | |
| Labour | Howard Stoate | 20,880 | 34.7 | +7.2 | |
| Liberal Democrat | Peter Bryden | 7,584 | 12.6 | −5.6 | |
| Fancy Dress Party | A Munro | 262 | 0.4 | −0.4 | |
| Natural Law | Angela Holland | 241 | 0.4 | N/A | |
| Majority | 10,314 | 17.2 | −8.9 | ||
| Turnout | 60,161 | 83.1 | +4.1 | ||
| Conservative hold | Swing | −4.4 | |||
Elections in the 1980s
| Party | Candidate | Votes | % | ± | |
|---|---|---|---|---|---|
| Conservative | Bob Dunn | 30,685 | 53.49 | ||
| Labour | BJ Clarke | 15,756 | 27.46 | ||
| Social Democratic | MG Bruce | 10,439 | 18.20 | ||
| Fancy Dress Party | KJ Davenport | 491 | 0.86 | ||
| Majority | 14,929 | 26.02 | |||
| Turnout | 78.99 | ||||
| Conservative hold | Swing | ||||
| Party | Candidate | Votes | % | ± | |
|---|---|---|---|---|---|
| Conservative | Bob Dunn | 28,199 | 51.56 | ||
| Labour | D Townsend | 14,636 | 26.76 | ||
| Liberal | J Mills | 11,204 | 20.48 | ||
| Fancy Dress Party | A Crockford | 374 | 0.68 | ||
| National Front | GE Nye | 282 | 0.52 | ||
| Majority | 13,563 | 24.80 | |||
| Turnout | 76.37 | ||||
| Conservative hold | Swing | ||||
Elections in the 1970s
| Party | Candidate | Votes | % | ± | |
|---|---|---|---|---|---|
| Conservative | Bob Dunn | 21,195 | 45.87 | ||
| Labour | Sydney Irving | 19,803 | 42.86 | ||
| Liberal | I Josephs | 4,407 | 9.54 | ||
| National Front | I Nobbs | 476 | 1.03 | ||
| Fancy Dress Party | J Beddowes | 328 | 0.71 | ||
| Majority | 1,392 | 3.01 | |||
| Turnout | 80.35 | ||||
| Conservative gain from Labour | Swing | ||||
| Party | Candidate | Votes | % | ± | |
|---|---|---|---|---|---|
| Labour | Sydney Irving | 20,817 | 47.64 | ||
| Conservative | Graham Bright | 15,331 | 35.09 | ||
| Liberal | George H Dunk | 6,606 | 15.12 | ||
| National Front | RH Aldous | 939 | 2.15 | ||
| Majority | 5,486 | 12.56 | |||
| Turnout | 76.60 | ||||
| Labour hold | Swing | ||||
| Party | Candidate | Votes | % | ± | |
|---|---|---|---|---|---|
| Labour | Sydney Irving | 19,803 | 41.98 | ||
| Conservative | Peter John Edward Trew | 16,149 | 34.24 | ||
| Liberal | IR Josephs | 10,273 | 21.78 | ||
| National Front | RH Aldous | 945 | 2.00 | ||
| Majority | 3,654 | 7.75 | |||
| Turnout | 83.44 | ||||
| Labour gain from Conservative | Swing | ||||
| Party | Candidate | Votes | % | ± | |
|---|---|---|---|---|---|
| Conservative | Peter John Edward Trew | 27,822 | 45.96 | ||
| Labour | Sydney Irving | 27,262 | 45.03 | ||
| Liberal | J Paul Johnson | 5,453 | 9.01 | ||
| Majority | 560 | 0.93 | |||
| Turnout | 74.02 | ||||
| Conservative gain from Labour | Swing | ||||
Elections in the 1960s
| Party | Candidate | Votes | % | ± | |
|---|---|---|---|---|---|
| Labour | Sydney Irving | 29,547 | 49.84 | ||
| Conservative | Peter John Edward Trew | 22,638 | 38.19 | ||
| Liberal | Peter Loftus | 7,094 | 11.97 | ||
| Majority | 6,909 | 11.66 | |||
| Turnout | 80.80 | ||||
| Labour hold | Swing | ||||
| Party | Candidate | Votes | % | ± | |
|---|---|---|---|---|---|
| Labour | Sydney Irving | 27,371 | 46.46 | ||
| Conservative | James J Davis | 22,496 | 38.18 | ||
| Liberal | Morris Janis | 9,047 | 15.36 | ||
| Majority | 4,875 | 8.27 | |||
| Turnout | 81.48 | ||||
| Labour hold | Swing | ||||
Elections in the 1950s
| Party | Candidate | Votes | % | ± | |
|---|---|---|---|---|---|
| Labour | Sydney Irving | 25,323 | 45.83 | ||
| Conservative | Peter Edward Walker | 24,047 | 43.52 | ||
| Liberal | Barry Charles Davis | 5,881 | 10.64 | ||
| Majority | 1,276 | 2.31 | |||
| Turnout | 82.96 | ||||
| Labour hold | Swing | ||||
| Party | Candidate | Votes | % | ± | |
|---|---|---|---|---|---|
| Labour | Sydney Irving | 25,928 | 54.40 | ||
| Conservative | Peter Edward Walker | 21,730 | 45.60 | ||
| Majority | 4,198 | 8.81 | |||
| Turnout | 80.98 | ||||
| Labour hold | Swing | ||||
| Party | Candidate | Votes | % | ± | |
|---|---|---|---|---|---|
| Labour | Norman Noel Dodds | 40,094 | 59.09 | ||
| Conservative | Margaret Hilda Roberts | 27,760 | 40.91 | ||
| Majority | 12,334 | 18.18 | |||
| Turnout | 85.22 | ||||
| Labour hold | Swing | 3.71% | |||
| Party | Candidate | Votes | % | ± | |
|---|---|---|---|---|---|
| Labour | Norman Noel Dodds | 38,128 | 56.38 | ||
| Conservative | Margaret Hilda Roberts | 24,490 | 36.21 | ||
| Liberal | Arthur Harry Giles | 5,011 | 7.41 | ||
| Majority | 13,638 | 20.17 | |||
| Turnout | 85.51 | ||||
| Labour hold | Swing | ||||
Election in the 1940s
| Party | Candidate | Votes | % | ± | |
|---|---|---|---|---|---|
| Labour | Norman Noel Dodds | 36,665 | 68.38 | ||
| Conservative | Ralph Ernest Watkins Grubb | 16,951 | 31.62 | ||
| Majority | 19,714 | 36.77 | |||
| Turnout | 74.89 | ||||
| Labour hold | Swing | ||||
- 1945 saw radical boundary changes, with half the constituency becoming part of the Bexley seat.
Elections in the 1930s
| Party | Candidate | Votes | % | ± | |
|---|---|---|---|---|---|
| Labour | Janet Laurel Adamson | 46,514 | |||
| Conservative | Godfrey Mitchell | 42,276 | |||
| Majority | 4,238 | ||||
| Turnout | 68.00 | ||||
| Labour gain from Conservative | Swing | ||||
| Party | Candidate | Votes | % | ± | |
|---|---|---|---|---|---|
| Conservative | Frank Edward Clarke | 38,242 | 51.79 | ||
| Labour | Janet Laurel Adamson | 35,596 | 48.21 | ||
| Majority | 2,646 | 3.58 | |||
| Turnout | 69.63 | ||||
| Conservative hold | Swing | ||||
| Party | Candidate | Votes | % | ± | |
|---|---|---|---|---|---|
| Conservative | Frank Edward Clarke | 34,095 | 55.49 | ||
| Labour | John Edmund Mills | 27,349 | 44.51 | ||
| Majority | 6,746 | 10.98 | |||
| Turnout | 79.01 | ||||
| Conservative gain from Labour | Swing | ||||
Elections in the 1920s
| Party | Candidate | Votes | % | ± | |
|---|---|---|---|---|---|
| Labour | John Edmund Mills | 26,871 | 50.6 | +1.6 | |
| Unionist | Ashley Edwards | 16,568 | 31.2 | -19.8 | |
| Liberal | John Woolfenden Williamson | 9,689 | 18.2 | n/a | |
| Majority | 10,303 | 19.4 | 21.4 | ||
| Turnout | 76.9 | -2.3 | |||
| Labour gain from Unionist | Swing | +10.7 | |||
| Party | Candidate | Votes | % | ± | |
|---|---|---|---|---|---|
| Unionist | Hon. Angus McDonnell | 20,108 | |||
| Labour | John Edmund Mills | 19,352 | |||
| Majority | |||||
| Turnout | |||||
| Unionist gain from Labour | Swing | ||||
| Party | Candidate | Votes | % | ± | |
|---|---|---|---|---|---|
| Labour | John Edmund Mills | 18,329 | 54.2 | +10.3 | |
| Constitutionalist | George William Symonds Jarrett | 15,500 | 45.8 | -3.8 | |
| Majority | 2,829 | 8.4 | 14.1 | ||
| Turnout | 70.0 | -1.2 | |||
| Labour gain from National Liberal | Swing | +7.0 | |||

| Party | Candidate | Votes | % | ± | |
|---|---|---|---|---|---|
| National Liberal | George William Symonds Jarrett | 16,662 | 49.6 | n/a | |
| Labour | John Edmund Mills | 14,744 | 43.9 | +6.3 | |
| Liberal | Alison Vickers Garland | 2,175 | 6.5 | -10.3 | |
| Majority | 1,918 | 5.7 | |||
| Turnout | 71.2 | ||||
| National Liberal gain from Labour | Swing | n/a | |||
| Party | Candidate | Votes | % | ± | |
|---|---|---|---|---|---|
| Labour | John Edmund Mills | 13,610 | 50.1 | +21.4 | |
| Liberal | Thomas Edward Wing | 4,562 | 16.8 | n/a | |
| Unionist | 4,221 | 15.6 | n/a | ||
| National Party | Reginald Vincent Kempenfelt Applin | 2,952 | n/a | ||
| Independent Unionist | Frank Emil Fehr | 1,802 | n/a | ||
| Majority | 9,048 | ||||
| Turnout | 61.3 | +13.4 | |||
| Labour gain from Coalition Liberal | Swing | ||||
- endorsed by Coalition Government
Elections in the 1910s

| Party | Candidate | Votes | % | ± | |
|---|---|---|---|---|---|
| Liberal | 15,626 | 71.4 | +20.8 | ||
| Labour | William Ling | 6,256 | 28.6 | n/a | |
| Majority | 9,370 | 42.8 | +41.6 | ||
| Turnout | 21,892 | ||||
| Unionist hold | Swing | n/a | |||
- endorsed by Coalition Government
General Election 1914/15:
Another General Election was required to take place before the end of 1915. The political parties had been making preparations for an election to take place and by the July 1914, the following candidates had been selected;
- Liberal: James Rowlands
- Unionist:
| Party | Candidate | Votes | % | ± | |
|---|---|---|---|---|---|
| Liberal | James Rowlands | 9,152 | 50.6 | +2.8 | |
| Conservative | William Foot Mitchell | 8,918 | 49.4 | -2.8 | |
| Majority | 234 | 1.2 | 5.6 | ||
| Turnout | 84.4 | -3.4 | |||
| Liberal gain from Conservative | Swing | +2.8 | |||
| Party | Candidate | Votes | % | ± | |
|---|---|---|---|---|---|
| Conservative | William Foot Mitchell | 9,807 | 52.2 | +10.8 | |
| Liberal | James Rowlands | 8,990 | 47.8 | -10.8 | |
| Majority | 817 | 4.4 | 21.6 | ||
| Turnout | 87.8 | +5.4 | |||
| Conservative gain from Liberal | Swing | +10.8 | |||
Elections in the 1900s

| Party | Candidate | Votes | % | ± | |
|---|---|---|---|---|---|
| Liberal | James Rowlands | 9,532 | 58.6 | n/a | |
| Conservative | Rt Hon. Sir William Hart Dyke | 6,728 | 41.4 | n/a | |
| Majority | 2,804 | 17.2 | n/a | ||
| Turnout | 82.4 | n/a | |||
| Liberal gain from Conservative | Swing | n/a | |||
| Party | Candidate | Votes | % | ± | |
|---|---|---|---|---|---|
| Conservative | Rt Hon. Sir William Hart Dyke | unopposed | n/a | n/a | |
| Conservative hold | Swing | n/a | |||
Elections in the 1890s
| Party | Candidate | Votes | % | ± | |
|---|---|---|---|---|---|
| Conservative | Rt Hon. Sir William Hart Dyke | 5,699 | 55.6 | n/a | |
| Liberal | Sir Patteson Nickalls | 4,557 | 44.4 | n/a | |
| Majority | 1,142 | 11.2 | n/a | ||
| Turnout | 73.8 | n/a | |||
| Conservative hold | Swing | n/a | |||
| Party | Candidate | Votes | % | ± | |
|---|---|---|---|---|---|
| Conservative | Rt Hon. Sir William Hart Dyke | unopposed | n/a | n/a | |
| Conservative hold | Swing | n/a | |||
Elections in the 1880s
| Party | Candidate | Votes | % | ± | |
|---|---|---|---|---|---|
| Conservative | Rt Hon. Sir William Hart Dyke | 4,198 | 58.6 | +5.8 | |
| Liberal | James Ebenezer Saunders | 2,965 | 41.4 | -5.8 | |
| Majority | 1,233 | 17.2 | +11.6 | ||
| Turnout | 64.1 | -11.9 | |||
| Conservative hold | Swing | +5.8 | |||

| Party | Candidate | Votes | % | ± | |
|---|---|---|---|---|---|
| Conservative | Rt Hon. Sir William Hart Dyke | 4,488 | 52.8 | n/a | |
| Liberal | James Ebenezer Saunders | 4,006 | 47.2 | n/a | |
| Majority | 482 | 5.6 | n/a | ||
| Turnout | 76.0 | n/a | |||
| Conservative win (new seat) | |||||
See also
Notes and references
- Notes
- ↑ A county constituency (for the purposes of election expenses and type of returning officer)
- ↑ As with all constituencies, the constituency elects one Member of Parliament (MP) by the first past the post system of election at least every five years.
- References
- ↑ "Electorate Figures - Boundary Commission for England". 2011 Electorate Figures. Boundary Commission for England. 4 March 2011. Retrieved 13 March 2011.
- ↑ "Election 2015: Five answers for an election geek". BBC News. Retrieved 2016-05-08.
- ↑ Unemployment claimants by constituency The Guardian
- ↑ Leigh Rayment's Historical List of MPs – Constituencies beginning with "D" (part 1)
- ↑ "Election Data 2015". Electoral Calculus. Archived from the original on 17 October 2015. Retrieved 17 October 2015.
- ↑ http://www.bbc.co.uk/news/politics/constituencies/E14000659
- 1 2 http://electionresults.blogspot.co.uk/2013/04/dartford-2015.html
- ↑ http://www.libdems.org.uk/general_election_candidates#South East
- ↑ "Election Data 2010". Electoral Calculus. Archived from the original on 17 October 2015. Retrieved 17 October 2015.
- ↑ "Election Data 2005". Electoral Calculus. Archived from the original on 15 October 2011. Retrieved 18 October 2015.
- ↑ "Election Data 2001". Electoral Calculus. Archived from the original on 15 October 2011. Retrieved 18 October 2015.
- ↑ "Election Data 1997". Electoral Calculus. Archived from the original on 15 October 2011. Retrieved 18 October 2015.
- ↑ "Election Data 1992". Electoral Calculus. Archived from the original on 15 October 2011. Retrieved 18 October 2015.
- ↑ "Politics Resources". Election 1992. Politics Resources. 9 April 1992. Retrieved 2010-12-06.
- ↑ "Election Data 1987". Electoral Calculus. Archived from the original on 15 October 2011. Retrieved 18 October 2015.
- ↑ "Election Data 1983". Electoral Calculus. Archived from the original on 15 October 2011. Retrieved 18 October 2015.
- 1 2 3 Craig, F. W. S. (1983). British parliamentary election results 1918-1949 (3 ed.). Chichester: Parliamentary Research Services. ISBN 0-900178-06-X.
- ↑ British Parliamentary Election Results 1918-1949, FWS Craig
- ↑ The Constitutional Year Book, 1925
- 1 2 Debretts House of Commons & Judicial Bench, 1922
- 1 2 3 4 5 6 7 8 British Parliamentary Election Results 1885-1918, FWS Craig
Coordinates: 51°25′N 0°15′E / 51.417°N 0.250°E