1984–85 Australian region cyclone season
| |
| Season summary map |
| First system formed |
3 December 1984 |
| Last system dissipated |
15 April 1985 |
| Strongest storm1 |
Kristy – 925 hPa (mbar), 220 km/h (140 mph) (10-minute sustained) |
| Tropical lows |
20 |
| Tropical cyclones |
18 |
| Severe tropical cyclones |
11 |
| Total fatalities |
0 |
| Total damage |
$3.5 million (1985 USD) |
| 1Strongest storm is determined by lowest pressure |
Australian region tropical cyclone seasons
1982–83, 1983–84, 1984–85, 1985–86, 1986–87 |
| Related articles |
|
|
The 1984–85 Australian region cyclone season was one of the most active seasons on record. It officially started on 1 November 1984, and officially ended on 30 April 1985.
Storms
Severe Tropical Cyclone Emma
| Category 3 severe tropical cyclone (Australian scale) |
| Tropical storm (SSHWS) |
|
|
| Duration |
3 December – 13 December |
| Peak intensity |
120 km/h (75 mph) (10-min) 967 hPa (mbar) |
A Category 3 cyclone, Emma struck Western Australia on December 12, 1984 as a Category 1 cyclone.[1]
Tropical Storm 04S
| Tropical storm (SSHWS) |
|
|
| Duration |
December 8 – December 13 |
| Peak intensity |
65 km/h (40 mph) (1-min) 996 hPa (mbar) |
Due to its minimal intensity, 04S was designated only as a tropical storm strength cyclone by the Joint Typhoon Warning Center (JTWC). The storm remained unnamed by the warning center in Darwin.
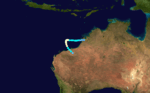
Severe Tropical Cyclone Frank
| Category 4 severe tropical cyclone (Australian scale) |
| Category 1 tropical cyclone (SSHWS) |
|
|
| Duration |
December 19 – December 28 |
| Peak intensity |
175 km/h (110 mph) (10-min) 952 hPa (mbar) |
Tropical Cyclone Frank was a significant tropical cyclone which formed off the western coast of Australia. It peaked as a Category 1 storm on the Saffir-Simpson Hurricane Scale according to the JTWC. Perth assessed it as a category 4 on the Australian scale. After it turned to the south-east on 25 December, it made landfall as a Category 2 two days later near Port Hedland, Western Australia.
Tropical Cyclone Monica
| Category 2 tropical cyclone (Australian scale) |
| Category 1 tropical cyclone (SSHWS) |
|
|
| Duration |
December 25 – December 28 |
| Peak intensity |
110 km/h (70 mph) (10-min) 975 hPa (mbar) |
Monica peaked as a category 2 storm, tracking roughly south-eastward, passing into the South Pacific basin on December 28.
Tropical Cyclone Nigel
| Category 1 tropical cyclone (Australian scale) |
| Tropical storm (SSHWS) |
|
|
| Duration |
January 14 – January 16 |
| Peak intensity |
85 km/h (50 mph) (10-min) 987 hPa (mbar) |
The precursor low to Cyclone Nigel formed as an ill defined low, within the intertropical convergence zone near the Cape York Peninsula during January 1985.[2] Over the next several days the system gradually moved eastwards into the Coral Sea, before the BoM reported that a recognizable circulation had developed during January 14.[2] Over the next two days the low moved eastwards and slowly developed further, before the JTWC initiated advisories on the system and designated it as Tropical Cyclone 13P early on January 16.[2][3] Later that day the BoM named the system Nigel as it became equivalent to a modern-day category 1 tropical cyclone on the Australian tropical cyclone intensity scale and moved out of the Australian region into the South Pacific basin.[2]
Severe Tropical Cyclone Odette
| Category 3 severe tropical cyclone (Australian scale) |
| Category 3 tropical cyclone (SSHWS) |
|
|
| Duration |
January 16 – January 19 |
| Peak intensity |
150 km/h (90 mph) (10-min) 930 hPa (mbar) |
Odette was a powerful cyclone.
Severe Tropical Cyclone Gertie
| Category 3 severe tropical cyclone (Australian scale) |
| Tropical storm (SSHWS) |
|
|
| Duration |
January 26 – February 3 |
| Peak intensity |
130 km/h (80 mph) (10-min) 974 hPa (mbar) |
Gertie made landfall in Western Australia before dissipating.
Tropical Low 18P
| Tropical low (Australian scale) |
| Tropical storm (SSHWS) |
|
|
| Duration |
February 2 – February 6 |
| Peak intensity |
55 km/h (35 mph) (10-min) 996 hPa (mbar) |
This system remained weak.
Severe Tropical Cyclone Hubert
| Category 4 severe tropical cyclone (Australian scale) |
| Tropical storm (SSHWS) |
|
|
| Duration |
February 10 – February 19 |
| Peak intensity |
165 km/h (105 mph) (10-min) 954 hPa (mbar) |
Hubert had major differences in peak intensity from BOM and JTWC, but did not touch land.
Severe Tropical Cyclone Isobel
| Category 3 severe tropical cyclone (Australian scale) |
| Tropical storm (SSHWS) |
|
|
| Duration |
February 11 – February 22 |
| Peak intensity |
155 km/h (100 mph) (10-min) 960 hPa (mbar) |
Isobel failed to affect land.
Severe Tropical Cyclone Jacob
| Category 4 severe tropical cyclone (Australian scale) |
| Category 1 tropical cyclone (SSHWS) |
|
|
| Duration |
February 15 – February 28 |
| Peak intensity |
175 km/h (110 mph) (10-min) 950 hPa (mbar) |
Jacoub was a Category 4 system on the Australian scale.
Tropical Depression 24S
| Tropical depression (MFR) |
| Tropical storm (SSHWS) |
|
|
| Duration |
February 18 – February 21 |
| Peak intensity |
55 km/h (35 mph) (10-min) 996 hPa (mbar) |
This depression failed to intensify.
Tropical Cyclone Pierre
| Category 1 tropical cyclone (Australian scale) |
| Tropical storm (SSHWS) |
|
|
| Duration |
February 18 – February 24 |
| Peak intensity |
75 km/h (45 mph) (10-min) 986 hPa (mbar) |
Pierre brushed Queensland.
Tropical Cyclone Rebecca
| Category 1 tropical cyclone (Australian scale) |
| Tropical storm (SSHWS) |
|
|
| Duration |
February 20 – February 23 |
| Peak intensity |
70 km/h (45 mph) (10-min) 994 hPa (mbar) |
Rebecca made landfall in Queensland on February 22, 1985 as a Category 1 storm.[4]
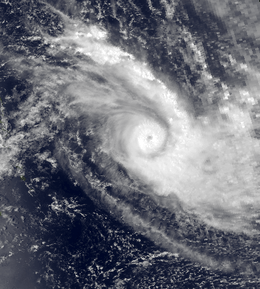
Severe Tropical Cyclone Kirsty
| Category 5 severe tropical cyclone (Australian scale) |
| Category 4 tropical cyclone (SSHWS) |
|
|
| Duration |
March 1 – March 19 |
| Peak intensity |
220 km/h (140 mph) (10-min) 920 hPa (mbar) |
Although powerful, Kirsty failed to affect land.
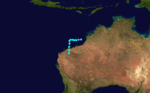
Severe Tropical Cyclone Lindsay
| Category 4 severe tropical cyclone (Australian scale) |
| Tropical storm (SSHWS) |
|
|
| Duration |
6 March – 11 March |
| Peak intensity |
175 km/h (110 mph) (10-min) 950 hPa (mbar) |
Cyclone Lindsay formed on March 6, 1985. The storm moved south-southeast reaching Category 4 status before making landfall near Broome, Western Australia.[5]
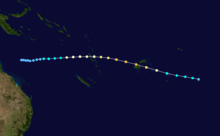
Severe Tropical Cyclone Sandy
| Category 4 severe tropical cyclone (Australian scale) |
| Category 4 tropical cyclone (SSHWS) |
|
|
| Duration |
19 March – 3 April |
| Peak intensity |
165 km/h (105 mph) (10-min) 953 hPa (mbar) |
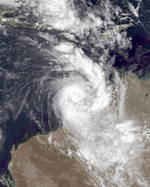
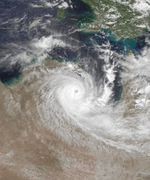
Sandy formed on March 19 in the Gulf of Carpentaria and strengthened rapidly into a Category 4 cyclone, before it made landfall near Sir Edward Pellew Group of Islands as a Category 2 cyclone on March 24. Over the next days, Sandy moved into the Indian Ocean and dissipated on April 3.
Similar to Cyclone Kathy, the storm was not as intense as Kathy. Two trawlers were devastated by Sandy, where swells of 12 m (39 ft) were measured. Storm surges were measured at 3 to 3.5 metres (9.8 to 11.5 ft) at Centre Island. Flooding was extensive along the southern gulf coast. A total of 860 mm (35 in) of rain recorded in the island during a four-day time span.[6]
Tropical Cyclone Tanya
| Category 2 tropical cyclone (Australian scale) |
| Tropical storm (SSHWS) |
|
|
| Duration |
March 27 – April 4 |
| Peak intensity |
100 km/h (65 mph) (10-min) 982 hPa (mbar) |
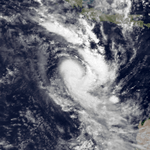
Tanya hit Australia as a tropical cyclone.
Severe Tropical Cyclone Margot
| Category 4 severe tropical cyclone (Australian scale) |
| Category 1 tropical cyclone (SSHWS) |
|
|
| Duration |
11 April – 21 April |
| Peak intensity |
185 km/h (115 mph) (10-min) 942 hPa (mbar) |
Cyclone Margot was a tropical cyclone that stayed out to sea during its entire duration. It was first identified on April 10, off the coast of Sunda Strait. Margot then traveled to the southwest during April 12, gradually intensifying to a tropical cyclone. In the noon hours of April 13, it began to move to the southeast, under the influence of an intense high pressure area to the south. The cyclone reached a peak intensity on April 14, as a category four cyclone using the Australian scale, with winds of 185 km/h (115 mph). This intensity was based on satellite estimates, but the strongest report was from a ship eighteen hours earlier. After peak intensity Margot gradually weakened up until the 19, when it briefly underwent intensification, and turned west. This was short lived however, as dry, easterly low-level winds and wind shear began to influence the cyclone. Margot began to rapidly weaken and move in an easterly direction on April 20. On the 21 Margot had become a remnant low after completing a figure-eight path. On the 25 the remnant low was absorbed by a broad low pressure system located in the northeast Indian Ocean.[7]
Tropical Cyclone Gretel
| Category 1 tropical cyclone (Australian scale) |
| Tropical storm (SSHWS) |
|
|
| Duration |
April 11 – April 14 |
| Peak intensity |
75 km/h (45 mph) (10-min) 984 hPa (mbar) |
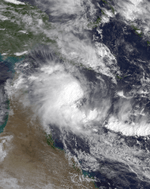
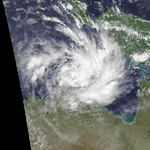
Cyclone Gretel was a tropical cyclone that formed in the Arafura Sea late on April 12, 1985, just east of Croker Island, off the Northern Territory coast. Moving in a west-southwest direction, it crossed the Cobourg Peninsula into the Van Diemen Gulf, where it intensified to Category 2 and reached its lowest pressure of 984 hPa. Moving south-west, the eye of the storm passed over Darwin, Australia, early on April 14, causing extensive tree damage and flooding to the area but no reported loss of life. It continued moving in a south-southwest direction, weakening to a low pressure system near the Victoria River mouth late that evening.[8] The total estimated damages was $3.5 million.[9]
See also
- Atlantic hurricane seasons: 1984, 1985,
- Eastern Pacific hurricane seasons: 1984, 1985
- Western Pacific typhoon seasons: 1984, 1985
- North Indian Ocean cyclone seasons: 1984, 1985
References

.JPG)


