1996–97 South Pacific cyclone season
 | |
| Season summary map | |
| First system formed | November 23, 1996 |
|---|---|
| Last system dissipated | June 17, 1997 |
| Strongest storm1 | Gavin – 925 hPa (mbar), 195 km/h (120 mph) (10-minute sustained) |
| Total depressions | 14 |
| Tropical cyclones | 12 |
| Severe tropical cyclones | 4 |
| Total fatalities | 7 direct, 2 indirect, 18 missing |
| Total damage | $125.91 million (1997 USD) |
| 1Strongest storm is determined by lowest pressure | |
1994–95, 1995–96, 1996–97, 1997–98, 1998–99 | |
| Related articles | |
The 1996–97 South Pacific cyclone season was one of the most active and longest South Pacific tropical cyclone seasons on record, with 12 tropical cyclones occurring within the South Pacific basin between 160°E and 120°W. The season officially ran from November 1, 1996 - April 30, 1998, however, the season ended later than normal with three systems monitored after the official end of the season. The strongest tropical cyclone of the season was Cyclone Gavin which had a minimum pressure of 925 hPa (27.32 inHg). After the season had ended 4 tropical cyclone names were retired from the naming lists, after the cyclones had caused significant impacts to South Pacific islands.
During the season, tropical cyclones were officially monitored by the Regional Specialized Meteorological Center (RSMC) in Nadi, Fiji and the Tropical Cyclone Warning Centers in Brisbane, Australia and Wellington, New Zealand. The United States Armed Forces through the Joint Typhoon Warning Center (JTWC) and Naval Pacific Meteorology and Oceanography Center (NPMOC), also monitored the basin and issued unofficial warnings for American interests. During the season RSMC Nadi issued warnings and assigned names to any tropical cyclones that developed between the Equator and 25°S while TCWC Wellington issued warnings for any that were located to the south of 25°S. The JTWC issued warnings for American interests on any significant tropical cyclone that was located between 160°E and the 180° while the NPMOC issued warnings for tropical cyclones forming between 180° and the American coast. RSMC Nadi and TCWC Wellington measure sustained windspeeds over a 10-minute and used the Australian tropical cyclone intensity scale, while the JTWC and the NPMOC measured sustained windspeeds over a 1-minute period which are compared to the Saffir-Simpson Hurricane Wind Scale (SSHWS).
Season summary
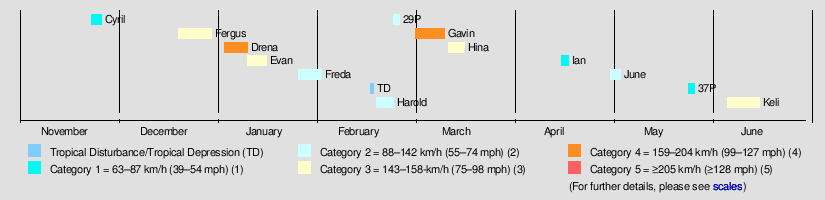
Ahead of the cyclone season starting on November 1, 1996, the weak to moderate La Nina episode that had caused tropical cyclone activity, to be generally confined to the Coral Sea during the previous season persisted.[1][2][3] However, during the season the La Nina episode started to break down, with signs emerging that the El Nino Episode of 1997-98 was starting to develop.[1][2] These signs included tropical cyclones occurring to the east of 165°E and the South Pacific Convergence Zone becoming more active.[1] The season officially featured a total of eleven tropical cyclones occurring in RSMC Nadi's area of responsibility to the north of 25S, while one developed in TCWC Wellington's area of responsibility and could not be named.[4][5][6] An additional system was monitored by the United States Joint Typhoon Warning Center, which was an unofficial warning centre for the region, along with the Naval Pacific Meteorology and Oceanography Center during the season.[7]
Significant tropical cyclones during the season included Fergus and Drena, which both impacted the island nations of Vanuatu, New Caledonia and New Zealand. Severe Tropical Cyclone Gavin was the strongest tropical cyclone and impacted the island nations of Tuvalu, Fiji, New Zealand, Wallis and Futuna. Severe Tropical Cyclone Hina subsequently became the worst tropical cyclone to affect the South Pacific island nation of Tonga since Cyclone Isaac in 1982. Three tropical cyclones developed after the season ended on April 30, including Severe Tropical Cyclone Keli which became the first recorded post-season tropical cyclone to form during June 1997. [8][9] The names Drena, Fergus, Gavin, Hina and Keli were subsequently retired, by the World Meteorological Organization's RA V Tropical Cyclone Committee.[10]
Storms
Tropical Cyclone Cyril
| Category 1 tropical cyclone (Australian scale) | |||
|---|---|---|---|
| Tropical storm (SSHWS) | |||
| |||
| Duration | November 23 – November 26 | ||
| Peak intensity | 85 km/h (50 mph) (10-min) 987 hPa (mbar) | ||

The storm produced heavy rains and high winds over New Caledonia before dissipating.[11]
Severe Tropical Cyclone Fergus
| Category 3 severe tropical cyclone (Australian scale) | |||
|---|---|---|---|
| Category 2 tropical cyclone (SSHWS) | |||
| |||
| Duration | December 20 – December 30 | ||
| Peak intensity | 150 km/h (90 mph) (10-min) 955 hPa (mbar) | ||


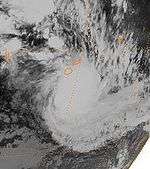
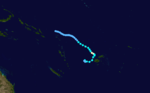
Fergus was a Category 2 storm that formed in the Pacific Ocean, lasting from 29 December to 31 December 1996 until becoming extratropical near New Zealand. The storm dropped heavy rainfall across an already saturated area, with totals of over 16.5 inches (425 mm) near Thames. The rainfall led to widespread flooding and forced many to evacuate. Severe road damage occurred, with some roads remaining closed for over a week. Gusty winds from Fergus downed trees and power lines, and caused property damage.[12] Cyclone Fergus brought torrential rain and damaging winds to parts of the North Island of New Zealand. There was no loss of life, in part because of timely warnings about the ferocity of the storm.[13] Damages from the storm were at least $2 million.[14]
Severe Tropical Cyclone Drena
| Category 4 severe tropical cyclone (Australian scale) | |||
|---|---|---|---|
| Category 4 tropical cyclone (SSHWS) | |||
| |||
| Duration | January 3 – January 10 | ||
| Peak intensity | 165 km/h (105 mph) (10-min) 935 hPa (mbar) | ||


On January 8, the weakening Cyclone Drena brushed the island of New Caledonia with sustained winds up to 150 km/h (90 mph 10-minute winds).[15] Heavy rains accompanied the storm, peaking at 474 mm (18.7 in) in Dzumac. La Foa also recorded 202 mm (8.0 in) of rain. Wind gusts reached 165 km/h (105 mph) in Koumac. Flooding from the storm caused a total loss of crops and the high winds knocked out power and communication to most of the island.[16][17]
Severe Tropical Cyclone Evan
| Category 3 severe tropical cyclone (FMS) | |||
|---|---|---|---|
| Category 1 tropical cyclone (SSHWS) | |||
| |||
| Duration | January 10 – January 16 | ||
| Peak intensity | 130 km/h (80 mph) (10-min) 965 hPa (mbar) | ||


Severe Tropical Cyclone Evan formed on January 10 and dissipated on January 16. Evan stayed northeast of New Zealand for its entire lifetime. Sustained winds peaked at 120 km/h (75 mph).
Tropical Cyclone Freda
| Category 2 tropical cyclone (Australian scale) | |||
|---|---|---|---|
| Category 1 tropical cyclone (SSHWS) | |||
| |||
| Duration | January 26 – February 2 | ||
| Peak intensity | 110 km/h (70 mph) (10-min) 980 hPa (mbar) | ||


Tropical Cyclone Freda existed from January 26 to February 2.
Tropical Cyclone Harold
| Category 2 tropical cyclone (Australian scale) | |||
|---|---|---|---|
| Tropical storm (SSHWS) | |||
| |||
| Duration | February 19 – February 24 | ||
| Peak intensity | 110 km/h (70 mph) (10-min) 975 hPa (mbar) | ||

The storm produced large swells along west-facing coasts of New Caledonia.[18]
Tropical Cyclone 29P
| Category 2 tropical cyclone (Australian scale) | |||
|---|---|---|---|
| Tropical storm (SSHWS) | |||
| |||
| Duration | February 24 – February 27 | ||
| Peak intensity | 110 km/h (70 mph) (10-min) 975 hPa (mbar) | ||


On February 21, the NPMOC started to monitor a tropical disturbance that had developed about 835 km (520 mi) to the northeast of Avarua on the Southern Cook Island of Rarotonga.[19] Over the next two days the disturbance gradually developed further as it moved towards the southwest, before RSMC Nadi and TCWC Wellington started to monitor it during February 24 while it was located about 315 km (195 mi) to the northeast of Avarua.[5][19] During that day the system continued to develop further as it moved towards the southwest and out of RSMC Nadi's area of responsibility during February 25.[5] As it moved into TCWC Wellington's area of responsibility, the system developed into a category one tropical cyclone, but it was not be named as it had developed into a tropical cyclone within the subtropics.[5][6]
After developing into a tropical cyclone the cyclone continued to intensify and develop further, before TCWC Wellington reported early on February 26 that the system had become a category 2 tropical cyclone.[5] The NPMOC subsequently started to issue warnings on the system and designated it as Tropical Cyclone 29P, while the cyclone was near its peak 1-minute sustained windspeeds of 85 km/h (50 mph).[7][19] Later that day after it had peaked, the cyclone started to transition into an extratropical cyclone, before the NPMOC issued its final advisory on the system during the next day as it weakened below tropical cyclone intensity.[5][7][15] The cyclone's remnants were subsequently last noted by TCWC Wellington during March 2, as it affected parts of New Zealand and caused flooding in Whangarei.[6][15]
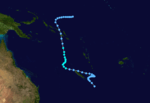
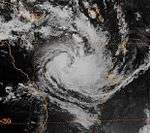
Severe Tropical Cyclone Gavin
| Category 4 severe tropical cyclone (Australian scale) | |||
|---|---|---|---|
| Category 4 tropical cyclone (SSHWS) | |||
| |||
| Duration | March 3 – March 12 | ||
| Peak intensity | 185 km/h (115 mph) (10-min) 925 hPa (mbar) | ||


Damages from the storm in Fiji amounted to $27 million.[20] Seven people were killed and 18 others were listed as missing due to Cyclone Gavin.[21]
Severe Tropical Cyclone Hina
| Category 3 severe tropical cyclone (Australian scale) | |||
|---|---|---|---|
| Category 1 tropical cyclone (SSHWS) | |||
| |||
| Duration | March 12 – March 18 | ||
| Peak intensity | 120 km/h (75 mph) (10-min) 970 hPa (mbar) | ||

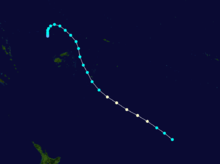
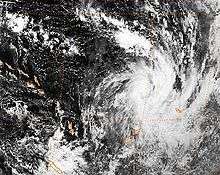
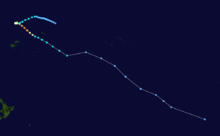
On March 11, RSMC Nadi started to monitor a shallow depression, that had developed along the monsoon trough near Rotuma.[22] Over the next two days the depression remained near Rotuma with no preferred movement, as it started to develop further within favourable conditions for further development.[22][23] During March 13, the JTWC subsequently initiated advisories on the system and designated it as Tropical Cyclone 33P.[24] During that day the system continued its northwards movement until it curved eastwards and later south-eastwards during March 14, before it passed about 55 km (35 mi) to the southeast of Niulakita the southernmost island of Tuvalu.[22] Early on March 15, after the system had passed near Niulakita, RSMC Nadi reported that the depression had developed into a category 1 tropical cyclone and named it Hina.[22] After being named the system accelerated towards the south-southeast and an area of increasing vertical wind shear, as it passed near the west coast of Futuna Island.[22] The system also crossed the 180th meridian during that day, which prompted the JTWC to pass the responsibility for warning the United States Government to the NPMOC.[25][26]
Early on March 16, RSMC Nadi reported that based on satellite imagery and guidance from other meteorological centers, the system had 10-minute sustained wind speeds of 85 km/h (55 mph) as it passed over Southern Tonga.[22][27] Hina subsequently passed over the islands of Tongatapu and ʻEua in southern Tonga at around 0830 UTC and took less than 2 hours to inflict considerable damage on the islands.[1][22] The system subsequently emerged back into the South Pacific Ocean, with RSMC Nadi estimating that the system had storm force winds of about 95 km/h (60 mph).[22] Later that day the NPMOC estimated that Hina had peak 1-minute sustained windspeeds of 110 km/h (70 mph) as it rapidly moved below 25°S and out of RSMC Nadi's area of responsibility.[22][28] After impacting Tonga the system moved rapidly towards the south-southeast and weakened below tropical cyclone intensity, before it was last noted on March 21, to the south of the Pitcairn Islands.[1][15] During the systems post analysis it was determined that the warning centers had underestimated Hina's intensity as it passed over Tonga, after damage had been greater than expected in the island nation. RSMC Nadi subsequently deduced that Hina was a minimal category 3 severe tropical cyclone, with peak 10-minute sustained wind speeds of 120 km/h (75 mph) when it impacted Tonga.[22] The NPMOC also revised their estimate of Hina's peak 1-minute sustained wind speeds from 110 km/h (70 mph) to 140 km/h (85 mph) during post analysis, which made the system equivalent to a category one hurricane on the Saffir–Simpson hurricane wind scale.[7][28][29]
Cyclone Hina caused widespread damage in Tonga, leaving roughly $14.5 million in damages.[30] About 320 families were left homeless after the storm.[31]
Tropical Cyclone Ian
| Category 1 tropical cyclone (Australian scale) | |||
|---|---|---|---|
| Tropical storm (SSHWS) | |||
| |||
| Duration | April 13 – April 19 | ||
| Peak intensity | 85 km/h (50 mph) (10-min) 987 hPa (mbar) | ||

On April 13, RSMC Nadi started to monitor a depression that had developed to the east of the Santa Cruz Islands. Over the next few days the depression slowly developed further before early on April 17 RSMC Nadi reported that the depression had become a category one tropical cyclone and named it Ian.
Tropical Cyclone June
| Category 2 tropical cyclone (Australian scale) | |||
|---|---|---|---|
| Category 1 tropical cyclone (SSHWS) | |||
| |||
| Duration | May 2 – May 5 | ||
| Peak intensity | 95 km/h (60 mph) (10-min) 985 hPa (mbar) | ||

On April 30, RSMC Nadi started to monitor a weak area of low pressure that had developed to the northwest of the Fijian dependency of Rotuma.[32] Over the next couple of days, the system remained poorly organised under the influence of vertical wind shear, from the northwest as it moved slowly towards the south-southwest.[32][33] During May 2, subsequently initiated advisories on the system and designated it as Tropical Cyclone 35P, after the vertical wind shear surrounding the system, had relaxed and good outflow had developed aloft.[33][34] During that day the system started to move towards the south-southeast and rapidly developed before RSMC Nadi reported later that day, that the system had developed into a category 1 tropical cyclone and named it June.[1][32] At this stage the system was located about 600 km (375 mi) to the northwest of Nadi, Fiji, and was expected to turn towards the southwest and a break in the subtropical ridge of high pressure during the next day.[32][35] During May 3, the system continued to develop further and became slow moving, before it started to appear on radar imagery later that day.[32] RSMC Nadi subsequently reported early the next day that the system had peaked as a category 2 tropical cyclone, with 10-minute sustained wind speeds of 95 km/h (60 mph).[15] Later that day the JTWC reported that the system had peaked with 1-minute sustained wind speeds of 120 km/h (75 mph), which made June equivalent to a category 1 hurricane on the SSHWS.[36]
Severe flooding produced by the storm in Fiji left roughly $500,000 in damages.[37]
Severe Tropical Cyclone Keli
| Category 3 severe tropical cyclone (FMS) | |||
|---|---|---|---|
| Category 4 tropical cyclone (SSHWS) | |||
| |||
| Duration | June 7 – June 17 | ||
| Peak intensity | 150 km/h (90 mph) (10-min) 955 hPa (mbar) | ||
On June 10, RSMC Nadi reported that a tropical cyclone had developed near Tuvalu, out of a tropical depression that had existed since June 7, and named it Keli.[9][38] During that day the system
Other systems
On February 18, a tropical depression formed to the northeast of Fiji and moved southwestwards, before it was last noted during the next day.[39] During May 26, the JTWC started monitoring a tropical disturbance that had developed to the southeast of the Solomon Islands, in response to strong westerly winds along the equator.[8][40] Over the next two days the disturbance gradually developed further, before the JTWC initiated advisories on the system and designated it as Tropical Cyclone 37P during May 28.[34] During the next day the system moved towards the south-southeast, before it peaked with 1-minute sustained wind speeds of 65 km/h (40 mph).[8] During May 30, the system dissipated as a significant tropical cyclone, after it had encountered cooler waters and stronger vertical windshear.[8][41]
Season effects
This table lists all the storms that developed in the South Pacific basin, to the east of 160E during the 1996–97 season. It includes their intensity on the Australian tropical cyclone intensity scale, duration, name, areas affected, deaths, and damages. For most storms the data is taken from TCWC Nadi and Wellingtons archives, however data for 37P has been taken from the JTWC archives rather than RSMC Nadi and TCWC Wellington's archives, and thus the winds are a period of 1-minute sustained as opposed to 10-minutes.
| Name | Dates active | Peak classification | Sustained wind speeds |
Pressure | Land areas affected | Damage (USD) |
Deaths | Refs |
|---|---|---|---|---|---|---|---|---|
| Cyril | November 23 – 26 | Category 1 tropical cyclone | 85 km/h (50 mph) | 987 hPa (29.15 inHg) | Solomon Islands, New Caledonia | |||
| Fergus | December 20 – 30 | Category 3 severe tropical cyclone | 150 km/h (90 mph) | 955 hPa (28.20 inHg) | Solomon Islands, Vanuatu New Caledonia, New Zealand | |||
| Drena | January 3 – 10 | Category 4 severe tropical cyclone | 165 km/h (90 mph) | 935 hPa (27.52 inHg) | Vanuatu, New Caledonia, New Zealand | |||
| Evan | January 4 – 14 | Category 3 severe tropical cyclone | 130 km/h (80 mph) | 965 hPa (28.50 inHg) | Fiji, Tonga | |||
| Freda | January 26 – February 2 | Category 2 tropical cyclone | 110 km/h (70 mph) | 980 hPa (28.94 inHg) | None | None | None | |
| Harold | February 19 – 24 | Category 2 tropical cyclone | 95 km/h (60 mph) | 985 hPa (29.10 inHg) | Melanesia, Australia, New Zealand | $27 million | 7 | |
| 29P | February 24 –26 | Category 2 tropical cyclone | 110 km/h (70 mph) | 975 hPa (28.70 inHg) | None | None | None | |
| Gavin | March 2 – 11 | Category 4 severe tropical cyclone | 185 km/h (115 mph) | 925 hPa (27.32 inHg) | Tuvalu, Wallis and Futuna, Fiji | $23.7 million | 23 | [nb 1][43] |
| Hina | March 13 – 18 | Category 3 severe tropical cyclone | 100 km/h (65 mph) | 980 hPa (28.94 inHg) | Fiji, Tonga | $15.2 million | 1 | [22] |
| Ian | April 13 – 19 | Category 1 tropical cyclone | 85 km/h (50 mph) | 987 hPa (29.15 inHg) | Fiji | None | Minimal | [44] |
| June | May 2 – 11 | Category 2 tropical cyclone | 95 km/h (60 mph) | 985 hPa (29.10 inHg) | Fiji | $60 million | [45] | |
| 37P | May 28 – 30 | Tropical cyclone | 65 km/h (40 mph) | 997 hPa (29.44 inHg) | Vanuatu | None | None | |
| Keli | June 7 – 17 | Category 3 severe tropical cyclone | 150 km/h (90 mph) | 955 hPa (28.20 inHg) | Tuvalu, Fiji, Samoan islands | $10 thousand | None | |
| Season Aggregates | ||||||||
| 13 systems | November 23 – June 17 | 90 km/h (120 mph) | 925 hPa (27.32 inHg) | |||||
Notes
- ↑ The damage total/economic loss was originally reported in Fijian dollars and was converted to USD via the Oanda Corporation website.[42]
See also
- List of Southern Hemisphere tropical cyclone seasons
- Atlantic hurricane seasons: 1996, 1997
- Pacific hurricane seasons: 1996, 1997
- Pacific typhoon seasons: 1996, 1997
- North Indian Ocean cyclone seasons: 1996, 1997
References
- 1 2 3 4 5 6 Hanstrum, Barry N; Reader, Grahame; Bate Peter W (September 3, 1999). "The South Pacific and Southeast Indian Ocean Tropical Cyclone Season 1996–97" (PDF). Australian Meteorological Magazine. Australian Bureau of Meteorology. 48 (3): 121–138. Archived (PDF) from the original on August 4, 2013. Retrieved May 24, 2015.
- 1 2 Lander, Mark A; Trehubenko, Eric J; Guard, Charles P (1999). "Eastern Hemisphere Tropical Cyclones of 1996". Monthly Weather Review. American Meteorological Society. 127 (6): 1297–1299. Bibcode:1999MWRv..127.1274L. doi:10.1175/1520-0493(1999)127<1274:EHTCO>2.0.CO;2. ISSN 1520-0493. Retrieved May 24, 2015.
- ↑ Callaghan, Jeff (December 4, 1997). "The South Pacific and Southeast Indian Ocean Tropical Cyclone Season 1995-96" (PDF). Australian Meteorological and Oceanographic Journal. Australian Bureau of Meteorology. 46: 325–339. Archived (PDF) from the original on May 24, 2015. Retrieved May 24, 2015.
- ↑ RSMC Nadi – Tropical Cyclone Centre (October 11, 2013). "2013/14 Tropical Cyclone Season Outlook in the Regional Specialised Meteorological Centre Nadi – Tropical Cyclone Centre Area of Responsibility" (PDF). Fiji Meteorological Service. p. 2. Archived (PDF) from the original on October 15, 2012. Retrieved October 15, 2013.
- 1 2 3 4 5 6 RSMC Nadi — Tropical Cyclone Centre; TCWC Brisbane; TCWC Wellington (May 22, 2009). "RSMC Nadi — Tropical Cyclone Centre Best Track Data for 1996/97 Cyclone Season". Fiji Meteorological Service, Meteorological Service of New Zealand Limited, Australian Bureau of Meteorology. United States: International Best Track Archive for Climate Stewardship. Retrieved January 31, 2013.
- 1 2 3 "Matt Megan's World". The Manawatu Standard. Palmerston North, New Zealand. April 2, 1997. p. 3. – via Lexis Nexis (subscription required)
- 1 2 3 4 Joint Typhoon Warning Center; Naval Pacific Meteorology and Oceanography Center (1998). 4. Summary of South Pacific and South Indian Ocean Tropical Cyclones (PDF) (Annual Tropical Cyclone Report: 1997). United States Navy, United States Air Force. pp. 132 — 142 (179 — 189). Retrieved January 31, 2013.
- 1 2 3 4 Joint Typhoon Warning Center; Naval Pacific Meteorology and Oceanography Center. "Tropical Cyclone 37P best track analysis". United States Navy, United States Air Force. Archived from the original on March 31, 2014. Retrieved March 31, 2014.
- 1 2 Darwin Regional Specialised Meteorological Centre (1997). "June 1997" (PDF). Darwin Tropical Diagnostic Statement. Australian Bureau of Meteorology. 16 (6): 2. ISSN 1321-4233. Archived (PDF) from the original on May 20, 2012. Retrieved May 22, 2012.
- ↑ RA V Tropical Cyclone Committee (May 5, 2015). List of Tropical Cyclone Names withdrawn from use due to a Cyclone's Negative Impact on one or more countries (PDF) (Tropical Cyclone Operational Plan for the South-East Indian Ocean and the Southern Pacific Ocean 2014). World Meteorological Organization. pp. 2B–1 – 2B–4 (23 – 26). Archived (PDF) from the original on May 24, 2015. Retrieved May 6, 2015.
- ↑ Staff Writer (December 1, 1996). "Earthwatch: Tropical Storms". The Spokesman-Review. Retrieved August 6, 2009.
- ↑ TCWC Wellington (2009). "Cyclone Fergus". MetService. Archived from the original on February 21, 2005. Retrieved August 6, 2009.
- ↑ "The Ghost of Cyclones Past: Drena, Fergus & the Cyclone of '36". TCWC Wellington. Archived from the original on August 3, 2004. Retrieved August 8, 2013.
- ↑ TCWC Wellington (2009). "Cyclone Fergus". MetService. Archived from the original on February 21, 2005. Retrieved August 6, 2009.
- 1 2 3 4 5 MetService (May 22, 2009). "TCWC Wellington Best Track Data 1967–2006". International Best Track Archive for Climate Stewardship.
- ↑ "Phénomènes tropicaux ayant le plus durement touché la Nouvelle-Calédonie depuis la fin du XIXe siècle" (in French). Meteo-France. 2009. Archived from the original on July 14, 2009. Retrieved August 5, 2009.
- ↑ Staff Writer (January 13, 1997). "Earthweek: A Diary of the Planet". Pittsburgh Post-Gazette. Retrieved August 5, 2009.
- ↑ Staff Writer (February 23, 1997). "Earthwatch: Tropical Storms". The Spokesman-Review. Retrieved August 6, 2009.
- 1 2 3 Joint Typhoon Warning Center; Naval Pacific Meteorology and Oceanography Center. "Tropical Cyclone 29P best track analysis". United States Navy, United States Air Force. Retrieved January 31, 2013.
- ↑ Australian Broadcasting Corporation (March 26, 1997). "Cyclone Gavin costs Fiji about 27 million dollars". ReliefWeb. Retrieved August 6, 2009.
- ↑ United Nations Department of Humanitarian Affairs (March 14, 1997). "Fiji —Cyclone Gavin DHA Situation Report No. 4". ReliefWeb. Retrieved August 6, 2009.
- 1 2 3 4 5 6 7 8 9 10 11 Prasad, Vikash R; RSMC Nadi — Tropical Cyclone Centre (March 4, 1998). Tropical Cyclone Hina: March 13 - 16, 1997 (PDF) (Tropical Cyclone Report: 96/8). Fiji Meteorological Service. Archived (PDF) from the original on August 4, 2013. Retrieved July 29, 2013.
- ↑ Joint Typhoon Warning Center (March 12, 1997). "Tropical Cyclone Formation Alert March 12, 1997 14z". United States Navy, United States Air Force. Archived from the original on August 5, 2013. Retrieved January 2, 2014.
- ↑ Joint Typhoon Warning Center (March 13, 1997). "Tropical Cyclone 33P (Hina) Warning 1; March 13, 1997 09z". United States Navy, United States Air Force. Archived from the original on August 5, 2013. Retrieved January 2, 2014.
- ↑ Joint Typhoon Warning Center (March 15, 1997). "Tropical Cyclone 33P (Hina) Warning 5; March 15, 1997 09z". United States Navy, United States Air Force. Archived from the original on August 5, 2013. Retrieved January 2, 2014.
- ↑ Joint Typhoon Warning Center (March 15, 1997). "Tropical Cyclone 33P (Hina) Warning 6; March 13, 1997 21z". United States Navy, United States Air Force. Archived from the original on August 5, 2013. Retrieved January 2, 2014.
- ↑ Report of Mission to Tonga — April 3-4, 1997 (PDF) (Report). Fiji Meteorological Service. 1997. Archived (PDF) from the original on November 17, 2013. Retrieved January 2, 2014.
- 1 2 Joint Typhoon Warning Center (March 16, 1997). "Tropical Cyclone 33P (Hina) Warning 8; March 16, 1997 21z". United States Navy, United States Air Force. Archived from the original on August 5, 2013. Retrieved January 2, 2014.
- ↑ Joint Typhoon Warning Center; Naval Pacific Meteorology and Oceanography Center. "Tropical Cyclone 33P (Hina) best track analysis". United States Navy, United States Air Force. Archived from the original on December 30, 2013. Retrieved January 2, 2014.
- ↑ Australian Broadcasting Corporation (March 24, 1997). "Cyclone damage in Tonga estimated at more than $14-million". ReliefWeb. Retrieved August 6, 2009.
- ↑ United Nations Department of Humanitarian Affairs (March 25, 1997). "Tonga: Cyclone Hina —Mar 1997 Situation Report No. 2". ReliefWeb. Retrieved August 6, 2009.
- 1 2 3 4 5 RSMC Nadi — Tropical Cyclone Centre (May 27, 1997). Preliminary Report on Tropical Cyclone "June" — May 3 - 5, 1997 (PDF) (Report). Fiji Meteorological Service. Archived (PDF) from the original on March 21, 2014. Retrieved March 21, 2014.
- 1 2 Joint Typhoon Warning Center (May 2, 1997). Tropical Cyclone Formation Alert May 2, 1997 04z (Report). United States Navy, United States Air Force. Archived from the original on March 24, 2014. Retrieved March 24, 2014.
- 1 2 Joint Typhoon Warning Center (May 2, 1997). Tropical Cyclone 35P (June) Warning 1 May 2, 1997 09z (Report). United States Navy, United States Air Force. Archived from the original on March 24, 2014. Retrieved March 24, 2014.
- ↑ Joint Typhoon Warning Center (May 2, 1997). Tropical Cyclone 35P (June) Warning 2 May 2, 1997 21z (Report). United States Navy, United States Air Force. Archived from the original on March 24, 2014. Retrieved March 24, 2014.
- ↑ "JTWC Best Track: Cyclone June 1997". Joint Typhoon Warning Center. 2002-12-17. Retrieved 2009-09-13.
- ↑ "Pacific Adaption to Climate Change: Fiji Islands" (PDF). Government of Fiji. 2006. Retrieved August 6, 2009.
- ↑ "Tropical Cyclone Keli" (Tropical Cyclone Information for the Southern Hemisphere). Australian Bureau of Meteorology. Archived from the original on March 31, 2014. Retrieved March 31, 2014.
- ↑ McGree, Simon; Yeo, Stephen W; Devi, Swastika (October 1, 2010). "Flooding in the Fiji Islands between 1840 and 2009" (PDF). Risk Frontiers. p. 41. Archived (PDF) from the original on July 26, 2014. Retrieved July 27, 2014.
- ↑ Joint Typhoon Warning Center (May 27, 1997). Tropical Cyclone Formation Alert May 27, 1997 14z (Report). United States Navy, United States Air Force. Archived from the original on March 31, 2014. Retrieved March 31, 2014.
- ↑ Joint Typhoon Warning Center (May 30, 1997). Tropical Cyclone 37P Warning 5 May 30, 1997 09z (Report). United States Navy, United States Air Force. Archived from the original on March 31, 2014. Retrieved March 31, 2014.
- ↑ "Historical Exchange Rates". Oanda Corporation. 2013. Retrieved 27 January 2013.
- ↑ Kersemakers, Mark; RSMC Nadi — Tropical Cyclone Centre (April 4, 1998). Tropical Cyclone Gavin: March 2 - 11, 1997 (PDF) (Tropical Cyclone Report 96/7). Fiji Meteorological Service. Archived (PDF) from the original on July 13, 2013. Retrieved January 31, 2013.
- ↑ Seru, Vive B; RSMC Nadi — Tropical Cyclone Centre (March 4, 1998). Tropical Cyclone Ian: April 17 - 19, 1997 (PDF) (Tropical Cyclone Report 96/9). Fiji Meteorological Service. Archived (PDF) from the original on July 18, 2013. Retrieved August 4, 2013.
- ↑ Laisenia, Tui (July 3, 2010). "Disaster Risk Management Risk — Fiji". Fiji National Disaster Management Office. Sentinel Asia. Archived from the original (PDF) on September 27, 2014. Retrieved September 27, 2014.
External links
- World Meteorological Organization
- Australian Bureau of Meteorology
- Fiji Meteorological Service
- Meteorological Service of New Zealand
- Joint Typhoon Warning Center
Tropical cyclones of the 1996–97 South Pacific cyclone season | ||
|---|---|---|
| ||
| ||