Colors of noise
| Colors of noise |
|---|
| White |
| Pink |
| Red (Brownian) |
| Grey |
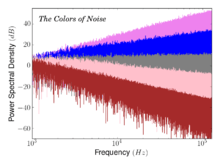
In audio engineering, electronics, physics, and many other fields, the color of noise refers to the power spectrum of a noise signal (a signal produced by a stochastic process). Different colors of noise have significantly different properties: for example, as audio signals they will sound different to human ears, and as images they will have a visibly different texture. Therefore, each application typically requires noise of a specific color. This sense of 'color' for noise signals is similar to the concept of timbre in music (which is also called "tone color"); however the latter is almost always used for sound, and may consider very detailed features of the spectrum.
The practice of naming kinds of noise after colors started with white noise, a signal whose spectrum has equal power within any equal interval of frequencies. That name was given by analogy with white light, which was (incorrectly) assumed to have such a flat power spectrum over the visible range. Other color names, like pink, red, and blue were then given to noise with other spectral profiles, often (but not always) in reference to the color of light with similar spectra. Some of those names have standard definitions in certain disciplines, while others are very informal and poorly defined. Many of these definitions assume a signal with components at all frequencies, with a power spectral density per unit of bandwidth proportional to 1/f β and hence they are examples of power-law noise. For instance, the spectral density of white noise is flat (β = 0), while flicker or pink noise has β = 1, and Brownian noise has β = 2.
Technical definitions
Various noise models are employed in analysis, many of which fall under the above categories. AR noise or "autoregressive noise" is such a model, and generates simple examples of the above noise types, and more. The Federal Standard 1037C Telecommunications Glossary defines white, pink, blue, and black.
The color names for these different types of sounds are derived from a loose analogy between the spectrum of frequencies of sound wave present in the sound (as shown in the blue diagrams) and the equivalent spectrum of light wave frequencies. That is, if the sound wave pattern of "blue noise" were translated into light waves, the resulting light would be blue, and so on.
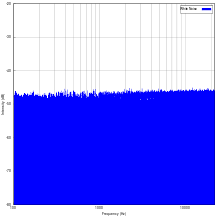
White noise
(logarithmic frequency axis)
White noise is a signal (or process), named by analogy to white light, with a flat frequency spectrum[1] when plotted as a linear function of frequency (e.g., in Hz). In other words, the signal has equal power in any band of a given bandwidth (power spectral density) when the bandwidth is measured in Hz. For example, with a white noise audio signal, the range of frequencies between 40 Hz and 60 Hz contains the same amount of sound power as the range between 400 Hz and 420 Hz, since both intervals are 20 Hz wide. Note that spectra are often plotted with a logarithmic frequency axis rather than a linear one, in which case equal physical widths on the printed or displayed plot do not all have the same bandwidth, with the same physical width covering more Hz at higher frequencies than at lower frequencies. In this case a white noise spectrum that is equally sampled in the logarithm of frequency (i.e., equally sampled on the X axis) will slope upwards at higher frequencies rather than being flat. However it is not unusual in practice for spectra to be calculated using linearly-spaced frequency samples but plotted on a logarithmic frequency axis, potentially leading to misunderstandings and confusion if the distinction between equally spaced linear frequency samples and equally spaced logarithmic frequency samples is not kept in mind.[2]
 |
10 seconds of white noise
 |
| Problems playing this file? See media help. | |
Pink noise

The frequency spectrum of pink noise is linear in logarithmic space; it has equal power in bands that are proportionally wide.[1][3] This means that pink noise would have equal power in the frequency range from 40 to 60 Hz as in the band from 4000 to 6000 Hz. Since humans hear in such a proportional space, where a doubling of frequency (an octave) is perceived the same regardless of actual frequency (40–60 Hz is heard as the same interval and distance as 4000–6000 Hz), every octave contains the same amount of energy and thus pink noise is often used as a reference signal in audio engineering. The spectral power density, compared with white noise, decreases by 3 dB per octave (density proportional to 1/f ). For this reason, pink noise is often called "1/f noise".
Since there are an infinite number of logarithmic bands at both the low frequency (DC) and high frequency ends of the spectrum, any finite energy spectrum must have less energy than pink noise at both ends. Pink noise is the only power-law spectral density that has this property: all steeper power-law spectra are finite if integrated to the high-frequency end, and all flatter power-law spectra are finite if integrated to the DC, low-frequency limit.
|
10 seconds of pink noise
|
| Problems playing this file? See media help. | |
Brown(ian) noise

In fields that adopt precise definitions, the terminology "red noise", also called Brown noise or Brownian noise, will usually refer to a power density which decreases 6 dB per octave with increasing frequency (density proportional to 1/f 2)[1] over a frequency range which does not include DC (in a general sense, does not include a constant component, or value at zero frequency). In areas where terminology is used loosely, "red noise" may refer to any system where power density decreases with increasing frequency.[4]
Brownian noise can be generated with temporal integration of White noise. "Brown" noise is not named for a power spectrum that suggests the colour brown; rather, the name derives from Brownian motion. "Red noise" describes the shape of the power spectrum, with pink being between red and white. Also known as "random walk" or "drunkard's walk".
|
10 seconds of Brown noise
|
| Problems playing this file? See media help. | |
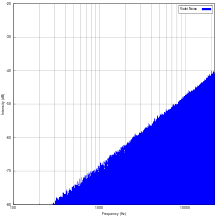
Blue noise

Blue noise is also called azure noise. Blue noise's power density increases 3 dB per octave with increasing frequency (density proportional to f ) over a finite frequency range.[1][5] In computer graphics, the term "blue noise" is sometimes used more loosely as any noise with minimal low frequency components and no concentrated spikes in energy. This can be good noise for dithering.[6] Retinal cells are arranged in a blue-noise-like pattern which yields good visual resolution.[6][7]
Cherenkov radiation is a naturally occurring example of almost perfect blue noise, with the power density growing linearly with frequency over spectrum regions where the permeability of index of refraction of the medium are approximately constant. The exact density spectrum is given by the Frank-Tamm formula. In this case, the finiteness of the frequency range comes from the finiteness of the range over which a material can have a refractive index greater than unity. Cherenkov radiation also appears as a bright blue color, for these reasons.
|
10 seconds of blue noise
|
| Problems playing this file? See media help. | |
Violet noise
Violet noise is also called purple noise. Violet noise's power density increases 6 dB per octave with increasing frequency[1][8][9] (density proportional to f 2) over a finite frequency range. It is also known as differentiated white noise, due to its being the result of the differentiation of a white noise signal.
Acoustic thermal noise of water has a violet spectrum, causing it to dominate hydrophone measurements at high frequencies.[10][11]
|
10 seconds of violet noise
|
| Problems playing this file? See media help. | |
Grey noise
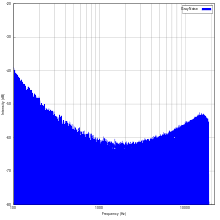
Grey noise is random white noise subjected to a psychoacoustic equal loudness curve (such as an inverted A-weighting curve) over a given range of frequencies, giving the listener the perception that it is equally loud at all frequencies. This is in contrast to standard white noise which has equal strength over a linear scale of frequencies but is not perceived as being equally loud due to biases in the human equal-loudness contour.
|
10 seconds of grey noise
|
| Problems playing this file? See media help. | |
Informal definitions
There are also many colors used without precise definitions (or as synonyms for formally defined colors), sometimes with multiple definitions.
Red noise
- A synonym for Brownian noise, as above[12]
- Similar to pink noise, but with different spectral content and different relationships (i.e. 1/f for pink noise, 1/f^2 for red noise).
Green noise
- The mid-frequency component of white noise, used in halftone dithering[13]
- Bounded Brownian noise
- Vocal spectrum noise used for testing audio circuits[14]
- Joseph S. Wisniewski wrote that "green noise", as marketed by producers of ambient sound effects recordings, is "supposedly the background noise of the world." It is noise that simulates the spectra of natural settings, without man-made noises. It is similar to pink noise but it has more energy in the area of 500 Hz.[14]
Black noise
Black noise is also called silent noise.
- Silence[1]
- Noise with a 1/fβ spectrum, where β > 2. This formula is used to model the frequency of natural disasters.[15]
- Noise that has a frequency spectrum of predominantly zero power level over all frequencies except for a few narrow bands or spikes. Note: An example of black noise in a facsimile transmission system is the spectrum that might be obtained when scanning a black area in which there are a few random white spots. Thus, in the time domain, a few random pulses occur while scanning.[16]
- Noise with a spectrum corresponding to the blackbody radiation (thermal noise). For temperatures higher than about 3×10⁻⁷ K the peak of the blackbody spectrum is above the upper limit to human Hearing range. In those situations, for the purposes of what is heard, black noise is well approximated as violet noise. At the same time, Hawking radiation of black holes may have a peak in hearing range, so the radiation of a typical stellar black hole with a mass equal to 6 solar masses will have a maximum at a frequency of 604.5 Hz, this noise is similar to green one. A formula is: Hz. Several examples of audio files with this spectrum can be found here.

Noisy white
In telecommunication, the term noisy white has the following meanings:[17]
- In facsimile or display systems, such as television, a nonuniformity in the white area of the image, i.e., document or picture, caused by the presence of noise in the received signal.
- A signal or signal level that is supposed to represent a white area on the object, but has a noise content sufficient to cause the creation of noticeable black spots on the display surface or record medium.
Noisy black
In telecommunication, the term noisy black has the following meanings:[18]
- In facsimile or display systems, such as television, a nonuniformity in the black area of the image, i.e., document or picture, caused by the presence of noise in the received signal.
- A signal or signal level that is supposed to represent a black area on the object, but has a noise content sufficient to cause the creation of noticeable white spots on the display surface or record medium.
See also
- Mains hum – also known as the AC power hum
- Whittle likelihood
References
- 1 2 3 4 5 6 Definition of "noise color" – Rane Pro Audio Reference
- ↑ R. D. Peters, 2012
- ↑ Definition of "pink noise" – Federal Standard 1037C
- ↑ Daniel L. Rudnick, Russ E. Davis (2003). "Red noise and regime shifts" (PDF). Deep-Sea Research Part I. 50 (6): 691–699. Bibcode:2003DSRI...50..691R. doi:10.1016/S0967-0637(03)00053-0.
- ↑ Definition of "blue noise" – Federal Standard 1037C
- 1 2 Mitchell, Don P., "Generating Antialiased Images at Low Sampling Densities." Computer Graphics, volume 21, number 4, July 1987.
- ↑ Yellott, John I. Jr., "Spectral Consequences of Photoreceptor Sampling in the Rhesus Retina." Science, volume 221, pp. 382–385, 1983. PMID 6867716
- ↑ Transactions of the American Society of Heating, Refrigerating and Air-Conditioning Engineers 1968 Quote: 'A "purple noise," accordingly, is a noise the spectrum level of which rises with frequency.'
- ↑ Estimating double difference GPS multipath under kinematicconditions. Zhang, Q.J. and Schwarz, K.-P.. Position Location and Navigation Symposium, p. 285–291. Apr 1996. 10.1109/PLANS.1996.509090 "The spectral analysis shows that GPS acceleration errors seem to be violet noise processes. They are dominated by high-frequency noise."
- ↑ Anthropogenic and natural sources of ambient noise in the ocean doi:10.3354/meps08353 "Predictions of the thermal noise spectrum, derived from classical statistical mechanics, suggest increasing noise with frequency with a positive slope of 6 dB octave−1" "Note that thermal noise increases at the rate of 20 dB decade−1"
- ↑ R. H. Mellen, The Thermal-Noise Limit in the Detection of Underwater Acoustic Signals, J. Acoust. Soc. Am. 24, 478-480 (1952).
- ↑ Index: Noise (Disciplines of Study [DoS])
- ↑ Green-Noise Digital Halftoning
- 1 2 Joseph S. Wisniewski (7 October 1996). "Colors of noise pseudo FAQ, version 1.3". Newsgroup: comp.dsp. Retrieved 2011-03-01.
- ↑ Schroeder, Manfred (2009). Fractals, Chaos, Power Laws: Minutes from an Infinite Paradise. Courier Dover. pp. 129–130. ISBN 0486472043.
- ↑ Definition of "black noise" – Federal Standard 1037C
- ↑ Definition of "noisy white" – Federal Standard 1037C
- ↑ Definition of "noisy black" – Federal Standard 1037C
![]() This article incorporates public domain material from the General Services Administration document "Federal Standard 1037C".
This article incorporates public domain material from the General Services Administration document "Federal Standard 1037C".
External links
- Some colored noise definitions
- Online Colored Noise Generator and True Grey Noise Generator
- Black Noise and Population Persistence
- 1/fα noise generator for Android