Coffey County, Kansas
| Coffey County, Kansas | |
|---|---|
| County | |
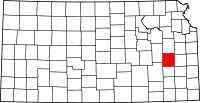 Location in the U.S. state of Kansas | |
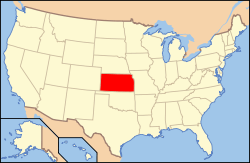 Kansas's location in the U.S. | |
| Founded | August 25, 1855 |
| Named for | Asbury M. Coffey |
| Seat | Burlington |
| Largest city | Burlington |
| Area | |
| • Total | 654 sq mi (1,694 km2) |
| • Land | 627 sq mi (1,624 km2) |
| • Water | 27 sq mi (70 km2), 4.2% |
| Population | |
| • (2010) | 8,601 |
| • Density | 14/sq mi (5/km²) |
| Congressional district | 2nd |
| Time zone | Central: UTC-6/-5 |
| Website |
CoffeyCountyKS |
Coordinates: 38°14′N 95°44′W / 38.233°N 95.733°W
Coffey County (county code CF) is a county located in Eastern Kansas. As of the 2010 census, the county population was 8,601.[1] Its county seat and most populous city is Burlington.[2]
History
Early history
For many millennia, the Great Plains of North America was inhabited by nomadic Native Americans. From the 16th century to 18th century, the Kingdom of France claimed ownership of large parts of North America. In 1762, after the French and Indian War, France secretly ceded New France to Spain, per the Treaty of Fontainebleau.
19th century
In 1802, Spain returned most of the land to France, but keeping title to about 7,500 square miles. In 1803, most of the land for modern day Kansas was acquired by the United States from France as part of the 828,000 square mile Louisiana Purchase for 2.83 cents per acre.
In 1854, the Kansas Territory was organized, then in 1861 Kansas became the 34th U.S. state. In 1855, Coffey County was established.
Geography
According to the U.S. Census Bureau, the county has a total area of 654 square miles (1,690 km2), of which 627 square miles (1,620 km2) is land and 27 square miles (70 km2) (4.2%) is water.[3]
Adjacent counties
- Osage County (north)
- Franklin County (northeast)
- Anderson County (east)
- Allen County (southeast)
- Woodson County (south)
- Greenwood County (southwest)
- Lyon County (northwest)
Major highways
Sources: National Atlas,[4] U.S. Census Bureau[5]
National protected area
Demographics
| Historical population | |||
|---|---|---|---|
| Census | Pop. | %± | |
| 1860 | 2,842 | — | |
| 1870 | 6,201 | 118.2% | |
| 1880 | 11,438 | 84.5% | |
| 1890 | 15,856 | 38.6% | |
| 1900 | 16,643 | 5.0% | |
| 1910 | 15,205 | −8.6% | |
| 1920 | 14,254 | −6.3% | |
| 1930 | 13,653 | −4.2% | |
| 1940 | 12,278 | −10.1% | |
| 1950 | 10,408 | −15.2% | |
| 1960 | 8,403 | −19.3% | |
| 1970 | 7,397 | −12.0% | |
| 1980 | 9,370 | 26.7% | |
| 1990 | 8,404 | −10.3% | |
| 2000 | 8,865 | 5.5% | |
| 2010 | 8,601 | −3.0% | |
| Est. 2015 | 8,384 | [6] | −2.5% |
| U.S. Decennial Census[7] 1790-1960[8] 1900-1990[9] 1990-2000[10] 2010-2013[1] | |||

Coffey County's population was estimated to be 8,701 in the year 2006, a decrease of 179, or −2.0%, over the previous six years.[11]
As of the U.S. Census in 2000,[12] there were 8,865 people, 3,489 households, and 2,477 families residing in the county. The population density was 14 people per square mile (5/km²). There were 3,876 housing units at an average density of 6 per square mile (2/km²). The racial makeup of the county was 96.95% White, 0.25% Black or African American, 0.52% Native American, 0.34% Asian, 0.01% Pacific Islander, 0.50% from other races, and 1.43% from two or more races. Hispanic or Latino of any race were 1.55% of the population.
There were 3,489 households out of which 33.20% had children under the age of 18 living with them, 60.70% were married couples living together, 6.90% had a female householder with no husband present, and 29.00% were non-families. 26.00% of all households were made up of individuals and 12.60% had someone living alone who was 65 years of age or older. The average household size was 2.49 and the average family size was 2.99.
In the county the population was spread out with 26.80% under the age of 18, 6.50% from 18 to 24, 26.40% from 25 to 44, 24.00% from 45 to 64, and 16.20% who were 65 years of age or older. The median age was 39 years. For every 100 females there were 96.20 males. For every 100 females age 18 and over, there were 92.50 males.
The median income for a household in the county was $37,839, and the median income for a family was $44,912. Males had a median income of $31,356 versus $20,666 for females. The per capita income for the county was $18,337. About 5.00% of families and 6.60% of the population were below the poverty line, including 5.00% of those under age 18 and 9.80% of those age 65 or over.
Law and government
Following amendment to the Kansas Constitution in 1986, the county remained a prohibition, or "dry", county until 2004, when voters approved the sale of alcoholic liquor by the individual drink with a 30% food sales requirement.[13]
Education
Unified school districts
Communities

Cities
Unincorporated communities
- Agricola
- Aliceville
- Crandall
- Crotty
- Halls Summit
- Ottumwa (ghost town[14])
- Section
- Sharpe
Townships
Coffey County is divided into fourteen townships. The city of Burlington is considered governmentally independent and is excluded from the census figures for the townships. In the following table, the population center is the largest city (or cities) included in that township's population total, if it is of a significant size.
| Township | FIPS | Population center |
Population | Population density /km² (/sq mi) |
Land area km² (sq mi) | Water area km² (sq mi) | Water % | Geographic coordinates |
|---|---|---|---|---|---|---|---|---|
| Avon | 03550 | 183 | 2 (6) | 80 (31) | 0 (0) | 0.40% | 38°10′1″N 95°35′16″W / 38.16694°N 95.58778°W | |
| Burlington | 09425 | 300 | 4 (10) | 81 (31) | 0 (0) | 0.48% | 38°10′40″N 95°45′18″W / 38.17778°N 95.75500°W | |
| Hampden | 29775 | 114 | 2 (5) | 56 (22) | 20 (8) | 26.43% | 38°12′14″N 95°42′10″W / 38.20389°N 95.70278°W | |
| Key West | 36650 | 237 | 2 (5) | 123 (48) | 1 (0) | 0.68% | 38°23′53″N 95°44′50″W / 38.39806°N 95.74722°W | |
| Le Roy | 39675 | 669 | 12 (32) | 54 (21) | 0 (0) | 0.39% | 38°5′2″N 95°38′5″W / 38.08389°N 95.63472°W | |
| Liberty | 39925 | 634 | 3 (9) | 186 (72) | 1 (0) | 0.57% | 38°6′0″N 95°53′7″W / 38.10000°N 95.88528°W | |
| Lincoln | 40550 | 1,268 | 7 (18) | 181 (70) | 3 (1) | 1.60% | 38°23′24″N 95°52′34″W / 38.39000°N 95.87611°W | |
| Neosho | 49750 | 140 | 1 (3) | 124 (48) | 0 (0) | 0.34% | 38°5′38″N 95°44′1″W / 38.09389°N 95.73361°W | |
| Ottumwa | 53700 | 740 | 6 (16) | 122 (47) | 15 (6) | 11.06% | 38°16′54″N 95°44′34″W / 38.28167°N 95.74278°W | |
| Pleasant | 56225 | 272 | 2 (4) | 158 (61) | 18 (7) | 10.40% | 38°13′57″N 95°53′38″W / 38.23250°N 95.89389°W | |
| Pottawatomie | 57200 | 217 | 2 (4) | 140 (54) | 1 (0) | 0.87% | 38°17′28″N 95°35′20″W / 38.29111°N 95.58889°W | |
| Rock Creek | 60500 | 1,025 | 7 (19) | 140 (54) | 1 (1) | 1.00% | 38°24′4″N 95°35′26″W / 38.40111°N 95.59056°W | |
| Spring Creek | 67375 | 118 | 1 (3) | 90 (35) | 1 (0) | 0.76% | 38°5′31″N 95°34′50″W / 38.09194°N 95.58056°W | |
| Star | 68000 | 158 | 2 (5) | 90 (35) | 1 (0) | 1.15% | 38°13′40″N 95°36′27″W / 38.22778°N 95.60750°W | |
| Sources: "Census 2000 U.S. Gazetteer Files". U.S. Census Bureau, Geography Division. | ||||||||
Notable people
- Alan L. Hart (1890–1962), transgender physician, radiologist, tuberculosis researcher, writer, and novelist
See also
|
|
References
- 1 2 "State & County QuickFacts". United States Census Bureau. Retrieved July 22, 2014.
- ↑ "Find a County". National Association of Counties. Archived from the original on May 31, 2011. Retrieved 2011-06-07.
- ↑ "US Gazetteer files: 2010, 2000, and 1990". United States Census Bureau. 2011-02-12. Retrieved 2011-04-23.
- ↑ National Atlas Archived December 5, 2008, at the Wayback Machine.
- ↑ U.S. Census Bureau TIGER shape files
- ↑ "County Totals Dataset: Population, Population Change and Estimated Components of Population Change: April 1, 2010 to July 1, 2015". Retrieved July 2, 2016.
- ↑ "U.S. Decennial Census". United States Census Bureau. Archived from the original on May 11, 2015. Retrieved July 22, 2014.
- ↑ "Historical Census Browser". University of Virginia Library. Retrieved July 22, 2014.
- ↑ "Population of Counties by Decennial Census: 1900 to 1990". United States Census Bureau. Retrieved July 22, 2014.
- ↑ "Census 2000 PHC-T-4. Ranking Tables for Counties: 1990 and 2000" (PDF). United States Census Bureau. Retrieved July 22, 2014.
- ↑ "Population Estimates". U.S. Census Bureau, Population Division. Annual estimates of the population to 2006-07-01. Released 2007-03-22. Six year change is from 2000-07-01 to 2006-07-01.
- ↑ "American FactFinder". United States Census Bureau. Archived from the original on September 11, 2013. Retrieved 2008-01-31.
- ↑ "Map of Wet and Dry Counties". Alcoholic Beverage Control, Kansas Department of Revenue. November 2006. Archived from the original on October 8, 2007. Retrieved December 26, 2007.
- ↑ "Ottumwa, Coffey County". Lost Kansas Communities. Retrieved 8 May 2014.
Further reading
- History of the State of Kansas; William G. Cutler; A.T. Andreas Publisher; 1883. (Online HTML eBook)
- Kansas : A Cyclopedia of State History, Embracing Events, Institutions, Industries, Counties, Cities, Towns, Prominent Persons, Etc; 3 Volumes; Frank W. Blackmar; Standard Publishing Co; 944 / 955 / 824 pages; 1912. (Volume1 – Download 54MB PDF eBook),(Volume2 – Download 53MB PDF eBook), (Volume3 – Download 33MB PDF eBook)
External links
| Wikimedia Commons has media related to Coffey County, Kansas. |
- County
- Maps
- Coffey County Maps: Current, Historic, KDOT
- Kansas Highway Maps: Current, Historic, KDOT
- Kansas Railroad Maps: Current, 1996, 1915, KDOT and Kansas Historical Society
 |
Lyon County | Osage County | Franklin County | |
| |
Anderson County | |||
| ||||
| | ||||
| Greenwood County | Woodson County | Allen County |
Municipalities and communities of Coffey County, Kansas, United States | ||
|---|---|---|
| Cities | | |
| Unincorporated communities |
| |
| Townships | ||