Carroll County, New Hampshire
| Carroll County, New Hampshire | |
|---|---|
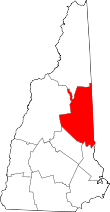 Location in the U.S. state of New Hampshire | |
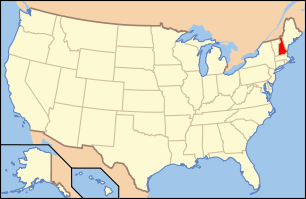 New Hampshire's location in the U.S. | |
| Founded | 1840 |
| Named for | Charles Carroll of Carrollton |
| Seat | Ossipee |
| Largest town | Conway |
| Area | |
| • Total | 992 sq mi (2,569 km2) |
| • Land | 931 sq mi (2,411 km2) |
| • Water | 61 sq mi (158 km2), 6.2% |
| Population | |
| • (2010) | 47,818 |
| • Density | 51/sq mi (20/km²) |
| Congressional district | 1st |
| Time zone | Eastern: UTC-5/-4 |
| Website |
www |
Carroll County is a county located in the state of New Hampshire, in the United States. As of the 2010 census, the population was 47,818,[1] making it the third-least populous county in New Hampshire. Its county seat is Ossipee.[2] The county was created in 1840 and organized at Ossipee from towns removed from Strafford County. It was named in honor of Charles Carroll of Carrollton,[3] who had died in 1832, the last surviving signer of the United States Declaration of Independence.
Geography
According to the U.S. Census Bureau, the county has a total area of 992 square miles (2,570 km2), of which 931 square miles (2,410 km2) is land and 61 square miles (160 km2) (6.2%) is water.[4] It is the third-largest county in New Hampshire by total area. Northern Carroll County is known for being mountainous. Several ski areas, including Cranmore Mountain, Attitash, King Pine, and Black Mountain, are located here.
Adjacent counties
- Coos County (north)
- Oxford County, Maine (northeast)
- York County, Maine (southeast)
- Strafford County (south)
- Belknap County (southwest)
- Grafton County (west)
National protected area
Demographics
| Historical population | |||
|---|---|---|---|
| Census | Pop. | %± | |
| 1850 | 20,157 | — | |
| 1860 | 20,465 | 1.5% | |
| 1870 | 17,332 | −15.3% | |
| 1880 | 18,224 | 5.1% | |
| 1890 | 18,124 | −0.5% | |
| 1900 | 16,895 | −6.8% | |
| 1910 | 16,316 | −3.4% | |
| 1920 | 15,017 | −8.0% | |
| 1930 | 14,277 | −4.9% | |
| 1940 | 15,589 | 9.2% | |
| 1950 | 15,868 | 1.8% | |
| 1960 | 15,829 | −0.2% | |
| 1970 | 18,548 | 17.2% | |
| 1980 | 27,931 | 50.6% | |
| 1990 | 35,410 | 26.8% | |
| 2000 | 43,666 | 23.3% | |
| 2010 | 47,818 | 9.5% | |
| Est. 2015 | 47,285 | [5] | −1.1% |
| U.S. Decennial Census[6] 1790-1960[7] 1900-1990[8] 1990-2000[9] 2010-2013[1] | |||
2000 census
As of the census[10] of 2000, there were 43,666 people, 18,351 households, and 12,313 families residing in the county. The population density was 18/km² (47/sq mi). There were 34,750 housing units at an average density of 14/km² (37/sq mi). The racial makeup of the county was 98.22% White, 0.17% Black or African American, 0.28% Native American, 0.38% Asian, 0.01% Pacific Islander, 0.17% from other races, and 0.77% from two or more races. 0.48% of the population were Hispanic or Latino of any race. 22.5% were of English, 15.6% Irish, 10.5% American, 9.7% French, 6.7% German, 5.8% Italian and 5.2% Scottish ancestry according to Census 2000. 96.5% spoke English and 1.6% French as their first language.
There were 18,351 households out of which 27.40% had children under the age of 18 living with them, 55.30% were married couples living together, 7.80% had a female householder with no husband present, and 32.90% were non-families. 26.60% of all households were made up of individuals and 11.10% had someone living alone who was 65 years of age or older. The average household size was 2.35 and the average family size was 2.82.
In the county the population was spread out with 22.60% under the age of 18, 5.30% from 18 to 24, 26.50% from 25 to 44, 27.70% from 45 to 64, and 17.80% who were 65 years of age or older. The median age was 42 years. For every 100 females there were 96.60 males. For every 100 females age 18 and over, there were 94.20 males.
The median income for a household in the county was $39,990, and the median income for a family was $46,922. Males had a median income of $31,811 versus $23,922 for females. The per capita income for the county was $21,931. About 5.50% of families and 7.90% of the population were below the poverty line, including 10.00% of those under age 18 and 6.70% of those age 65 or over.
2010 census
As of the 2010 United States Census, there were 47,818 people, 21,052 households, and 13,569 families residing in the county.[11] The population density was 51.4 inhabitants per square mile (19.8/km2). There were 39,813 housing units at an average density of 42.8 per square mile (16.5/km2).[12] The racial makeup of the county was 97.5% white, 0.6% Asian, 0.3% American Indian, 0.3% black or African American, 0.2% from other races, and 1.1% from two or more races. Those of Hispanic or Latino origin made up 1.0% of the population.[11] In terms of ancestry,[13]
The largest ancestry group in Carroll County are people of English ancestry, who make up 29.3% of people in the county. The second largest ancestry group in the county are people of Irish ancestry who make up 24.7%. The third largest group is people of French ancestry who make up 13.8% of people in the county.[14]
Of the 21,052 households, 24.2% had children under the age of 18 living with them, 52.2% were married couples living together, 8.1% had a female householder with no husband present, 35.5% were non-families, and 28.4% of all households were made up of individuals. The average household size was 2.25 and the average family size was 2.72. The median age was 48.3 years.[11]
The median income for a household in the county was $49,897 and the median income for a family was $60,086. Males had a median income of $41,634 versus $32,402 for females. The per capita income for the county was $28,411. About 6.1% of families and 9.6% of the population were below the poverty line, including 14.6% of those under age 18 and 5.5% of those age 65 or over.[15]
Politics
| Year | GOP | DEM |
|---|---|---|
| 2012 | 49.7% 14,207 | 48.9% 13,977 |
| 2008 | 46.1% 13,387 | 52.4% 15,221 |
| 2004 | 51.8% 14,614 | 47.2% 13,319 |
| 2000 | 52.8% 12,597 | 41.3% 9,852 |
| 1996 | 44.2% 9,168 | 42.8% 8,881 |
| 1992 | 40.2% 8,715 | 33.4% 7,258 |
| 1988 | 70.8% 12,983 | 28.1% 5,153 |
| 1984 | 75.4% 11,891 | 24.1% 3,806 |
| 1980 | 67.2% 9,980 | 21.0% 3,119 |
| 1976 | 70.2% 8,561 | 27.7% 3,374 |
| 1972 | 77.0% 8,525 | 21.6% 2,395 |
| 1968 | 72.9% 6,795 | 23.2% 2,163 |
| 1964 | 55.0% 4,957 | 45.0% 4,058 |
| 1960 | 79.6% 7,487 | 20.4% 1,918 |
The county is historically Republican, but in 2008 Barack Obama received 52.39% of the county's vote.[16] This made him the first Democratic presidential nominee to win the county since 1912 and the first Democratic presidential nominee to win an absolute majority in the county since 1884.
The county is politically divided between the more conservative southern half, home to several seasonal communities along the north shore of Lake Winnipesaukee including Moultonborough, Tuftonboro, and Wolfeboro, and the more liberal northern half, with several ski towns and resort towns such as Bartlett and Conway. In both the 2012 Presidential and gubernatorial elections in New Hampshire, Democratic candidates easily won the northern half of the county, and Republican candidates easily won the southern half of the county.[17]
Communities
Towns
Township
Census-designated places
Villages
See also
References
- 1 2 "State & County QuickFacts". United States Census Bureau. Retrieved September 24, 2013.
- ↑ "Find a County". National Association of Counties. Archived from the original on 2011-05-31. Retrieved 2011-06-07.
- ↑ Gannett, Henry (1905). The Origin of Certain Place Names in the United States. Govt. Print. Off. p. 70.
- ↑ "2010 Census Gazetteer Files". United States Census Bureau. August 22, 2012. Retrieved December 27, 2014.
- ↑ "County Totals Dataset: Population, Population Change and Estimated Components of Population Change: April 1, 2010 to July 1, 2015". Retrieved July 2, 2016.
- ↑ "U.S. Decennial Census". United States Census Bureau. Archived from the original on May 11, 2015. Retrieved December 27, 2014.
- ↑ "Historical Census Browser". University of Virginia Library. Retrieved December 27, 2014.
- ↑ "Population of Counties by Decennial Census: 1900 to 1990". United States Census Bureau. Retrieved December 27, 2014.
- ↑ "Census 2000 PHC-T-4. Ranking Tables for Counties: 1990 and 2000" (PDF). United States Census Bureau. Retrieved December 27, 2014.
- ↑ "American FactFinder". United States Census Bureau. Archived from the original on 2013-09-11. Retrieved 2008-01-31.
- 1 2 3 "DP-1 Profile of General Population and Housing Characteristics: 2010 Demographic Profile Data". United States Census Bureau. Retrieved 2016-01-12.
- ↑ "Population, Housing Units, Area, and Density: 2010 - County". United States Census Bureau. Retrieved 2016-01-12.
- ↑ "DP02 SELECTED SOCIAL CHARACTERISTICS IN THE UNITED STATES – 2006-2010 American Community Survey 5-Year Estimates". United States Census Bureau. Retrieved 2016-01-12.
- ↑ "Archived copy". Archived from the original on 2016-04-17. Retrieved 2010-10-17.
- ↑ "DP03 SELECTED ECONOMIC CHARACTERISTICS – 2006-2010 American Community Survey 5-Year Estimates". United States Census Bureau. Retrieved 2016-01-12.
- ↑ David Leip's Presidential Election Database
- ↑
External links
| Wikimedia Commons has media related to Carroll County, New Hampshire. |
- Carroll County official website
- National Register of Historic Places listing for Carroll Co., New Hampshire
 |
Coos County | Oxford County, Maine | | |
| Grafton County | |
|||
| ||||
| | ||||
| Belknap County | Strafford County | York County, Maine |
Municipalities and communities of Carroll County, New Hampshire, United States | ||
|---|---|---|
| Towns | | |
| Township | ||
| CDPs | ||
| Other villages | ||
Coordinates: 43°52′N 71°13′W / 43.87°N 71.21°W