Cardiff West (UK Parliament constituency)
Coordinates: 51°29′10″N 3°12′50″W / 51.486°N 3.214°W
| Cardiff West | |
|---|---|
|
Borough constituency for the House of Commons | |
|
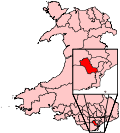
Boundary of Cardiff West in Wales. | |
| Preserved county | South Glamorgan |
| Population | 91,027 (2011 census)[1] |
| Electorate | 64,295 (December 2010)[2] |
| Current constituency | |
| Created | 1950 |
| Member of parliament | Kevin Brennan (Labour) |
| Number of members | One |
| Created from | Cardiff |
| Overlaps | |
| Welsh Assembly | South Wales Central |
| European Parliament constituency | Wales |
Cardiff West (Welsh: Gorllewin Caerdydd) is a borough constituency in the city of Cardiff. It returns one Member of Parliament (MP) to the House of Commons of the Parliament of the United Kingdom, elected by the first past the post voting system. It was created in 1950.
History
A traditionally safe Labour seat, represented for 33 years by George Thomas (who became Speaker in 1976 and was re-elected without party affiliation in 1979). It has returned a Conservative only once, in the Tories' landslide year of 1983, when Stefan Terlezki became the MP.
Labour regained the seat at the next general election in 1987, when Rhodri Morgan was elected. After the creation of the Welsh Assembly Government, Morgan stepped down from his Westminster seat in 2001 to serve as leader of Welsh Labour and First Minister for Wales. Kevin Brennan retained the seat for Labour on Morgan's retirement from Westminster politics and has remained the MP ever since.
Boundaries
1950-1974: The County Borough of Cardiff wards of Canton, Ely, Grangewater, Llandaff, and Riverside.
1974-1983: The County Borough of Cardiff wards of Canton, Ely, Llandaff, Plasmawr, and Riverside.
1983-2010: The City of Cardiff wards of Caerau, Canton, Ely, Fairwater, Llandaff, Radyr and St Fagans, and Riverside.
2010–present: The Cardiff electoral divisions of Caerau, Canton, Creigiau and St Fagans, Ely, Fairwater, Llandaff, Pentyrch, Radyr, and Riverside.
Cardiff West is entirely within the boundaries of the city of Cardiff, taking up the northwestern quarter of the borough at the boundaries of the boroughs of Rhondda Cynon Taf and Vale of Glamorgan. Population areas within the constituency include Riverside, Pontcanna, St Fagans and Ely.
Members of Parliament
| Election | Member[3][4] | Party | Notes | |
|---|---|---|---|---|
| 1950 | George Thomas | Labour | Previously MP for Cardiff Central from 1945. Secretary of State for Wales 1968-1970; Chairman of Ways and Means 1974-1976; Speaker of the House of Commons 1976-1983 | |
| 1976 | Speaker | |||
| 1983 | Stefan Terlezki | Conservative | ||
| 1987 | Rhodri Morgan | Labour | First Minister of the Welsh Assembly Government 2000-09 | |
| 2001 | Kevin Brennan | Labour | ||
Elections
Elections in the 2010s
| Party | Candidate | Votes | % | ± | |
|---|---|---|---|---|---|
| Labour | Kevin Denis Brennan | 17,803 | 40.7 | −0.6 | |
| Conservative | James Taghdissian | 11,014 | 25.2 | −4.5 | |
| Plaid Cymru | Neil McEvoy | 6,096 | 13.9 | +6.9 | |
| UKIP | Brian Morris | 4,923 | 11.2 | +8.5 | |
| Liberal Democrat | Cadan ap Tomos | 2,069 | 4.7 | −12.8 | |
| Green | Ken Barker | 1,704 | 3.9 | +2.1 | |
| TUSC | Helen Jones | 183 | 0.4 | n/a | |
| Majority | 6,789 | 15.5 | +3.9 | ||
| Turnout | 43,792 | 65.6 | +0.4 | ||
| Labour hold | Swing | +1.9 | |||
| Party | Candidate | Votes | % | ± | |
|---|---|---|---|---|---|
| Labour | Kevin Denis Brennan | 16,893 | 41.2 | −3.6 | |
| Conservative | Angela Jones-Evans | 12,143 | 29.6 | +7.0 | |
| Liberal Democrat | Rachael Hitchinson | 7,186 | 17.5 | +0.5 | |
| Plaid Cymru | Mohammed Sarul Islam | 2,868 | 7.0 | −5.9 | |
| UKIP | Michael Hennessey | 1,117 | 2.7 | +0.6 | |
| Green | Jake Griffiths | 750 | 1.8 | +1.8 | |
| Majority | 4,750 | 11.6 | |||
| Turnout | 40,957 | 65.2 | +7.0 | ||
| Labour hold | Swing | −5.3 | |||
Elections in the 2000s
| Party | Candidate | Votes | % | ± | |
|---|---|---|---|---|---|
| Labour | Kevin Denis Brennan | 15,729 | 45.5 | −9.1 | |
| Conservative | Simon Baker | 7,562 | 21.9 | +0.6 | |
| Liberal Democrat | Alison Goldsworthy | 6,060 | 17.5 | +4.4 | |
| Plaid Cymru | Neil McEvoy | 4,316 | 12.5 | +2.8 | |
| UKIP | Joe Callan | 727 | 2.1 | +0.7 | |
| Rainbow Dream Ticket | Catherine Taylor-Dawson | 167 | 0.5 | N/A | |
| Majority | 8,167 | 23.6 | |||
| Turnout | 34,561 | 57.7 | −0.7 | ||
| Labour hold | Swing | −4.8 | |||
| Party | Candidate | Votes | % | ± | |
|---|---|---|---|---|---|
| Labour | Kevin Denis Brennan | 18,594 | 54.6 | −5.8 | |
| Conservative | Andrew Robert Tudor Davies | 7,273 | 21.3 | −0.2 | |
| Liberal Democrat | Jacqui Gasson | 4,458 | 13.1 | +2.2 | |
| Plaid Cymru | Prof. Ifor Delme Bowen | 3,296 | 9.7 | +4.8 | |
| UKIP | Mrs. Joyce Lilian Jenking | 462 | 1.4 | N/A | |
| Majority | 11,321 | 33.3 | |||
| Turnout | 34,083 | 58.4 | −10.7 | ||
| Labour hold | Swing | ||||
Elections in the 1990s
| Party | Candidate | Votes | % | ± | |
|---|---|---|---|---|---|
| Labour | Rhodri Morgan | 24,297 | 60.3 | +7.1 | |
| Conservative | Simon Hoare | 8,669 | 21.5 | −11.4 | |
| Liberal Democrat | Jacqui Gasson | 4,366 | 10.8 | −0.1 | |
| Plaid Cymru | Gwenillian Carr | 1,949 | 4.8 | +2.3 | |
| Referendum | Trefor Johns | 996 | 2.5 | N/A | |
| Majority | 15,628 | 38.8 | |||
| Turnout | 40,277 | 69.2 | |||
| Labour hold | Swing | ||||
| Party | Candidate | Votes | % | ± | |
|---|---|---|---|---|---|
| Labour | Rhodri Morgan | 24,306 | 53.2 | +7.7 | |
| Conservative | Michael J. Prior | 15,015 | 32.9 | −3.6 | |
| Liberal Democrat | Jacqui Gasson | 5,002 | 10.9 | −5.4 | |
| Plaid Cymru | Miss Penni M. Bestic | 1,177 | 2.6 | +0.9 | |
| Natural Law | Andrew E. Harding | 184 | 0.4 | +0.4 | |
| Majority | 9,291 | 20.3 | +11.3 | ||
| Turnout | 45,684 | 77.5 | −0.3 | ||
| Labour hold | Swing | +5.6 | |||
Elections in the 1980s
| Party | Candidate | Votes | % | ± | |
|---|---|---|---|---|---|
| Labour | Rhodri Morgan | 20,329 | 45.5 | ||
| Conservative | Stefan Terlezki | 16,284 | 36.5 | ||
| Social Democratic | Robert Geoffrey Drake | 7,300 | 16.4 | ||
| Plaid Cymru | Peter John Keelan | 736 | 1.7 | ||
| Majority | 4,045 | 9.1 | |||
| Turnout | 77.8 | ||||
| Labour gain from Conservative | Swing | ||||
| Party | Candidate | Votes | % | ± | |
|---|---|---|---|---|---|
| Conservative | Stefan Terlezki | 15,472 | 38.0 | ||
| Labour | David Seligman | 13,698 | 33.6 | ||
| Social Democratic | Jeffrey Thomas | 10,388 | 25.5 | ||
| Plaid Cymru | Meurig Parri | 848 | 2.1 | ||
| Ecology | Graham Jones | 352 | 0.9 | ||
| Majority | 1,774 | 4.4 | |||
| Turnout | 40,758 | 69.6 | |||
| Conservative gain from Speaker | Swing | ||||
Elections in the 1970s
| Party | Candidate | Votes | % | ± | |
|---|---|---|---|---|---|
| Speaker | George Thomas | 27,035 | 85.6 | +35.6 | |
| Plaid Cymru | A. Ogwen | 3,272 | 10.4 | +4.9 | |
| National Front | C. Gibbon | 1,287 | 4.1 | N/A | |
| Majority | 23,763 | 75.2 | +56.8 | ||
| Turnout | 31,594 | 60.8 | -8.9 | ||
| Speaker gain from Labour | Swing | ||||
| Party | Candidate | Votes | % | ± | |
|---|---|---|---|---|---|
| Labour | George Thomas | 18,153 | 50.0 | ||
| Conservative | W. F. Dunn | 11,481 | 31.6 | ||
| Liberal | R. M. James | 4,669 | 12.9 | ||
| Plaid Cymru | D. Hughes | 2,008 | 5.5 | ||
| Majority | 6,672 | 18.4 | |||
| Turnout | 69.7 | ||||
| Labour hold | Swing | ||||
| Party | Candidate | Votes | % | ± | |
|---|---|---|---|---|---|
| Labour | George Thomas | 16,712 | 44.0 | ||
| Conservative | G. J. Neale | 13,366 | 35.2 | ||
| Liberal | R. M. James | 5,812 | 15.3 | ||
| Plaid Cymru | D. Hughes | 2,093 | 5.5 | ||
| Majority | 3,346 | 8.8 | |||
| Turnout | 73.6 | ||||
| Labour hold | Swing | ||||
| Party | Candidate | Votes | % | ± | |
|---|---|---|---|---|---|
| Labour | George Thomas | 21,655 | 49.8 | ||
| Conservative | Robert C. Williams | 15,878 | 36.5 | ||
| Plaid Cymru | D. Hughes | 4,378 | 10.1 | ||
| Liberal | Stephen Robert Charles Wanhill | 1,594 | 3.7 | ||
| Majority | 5,777 | 13.3 | |||
| Turnout | 71.0 | ||||
| Labour hold | Swing | ||||
Elections in the 1960s
| Party | Candidate | Votes | % | ± | |
|---|---|---|---|---|---|
| Labour | George Thomas | 26,139 | 61.00 | ||
| Conservative | SW Doxsey | 16,714 | 39.00 | ||
| Majority | 9,425 | 21.99 | |||
| Turnout | 75.06 | ||||
| Labour hold | Swing | ||||
| Party | Candidate | Votes | % | ± | |
|---|---|---|---|---|---|
| Labour | George Thomas | 25,998 | 59.17 | ||
| Conservative | KT Flynn | 17,941 | 40.83 | ||
| Majority | 8,057 | 18.34 | |||
| Turnout | 76.40 | ||||
| Labour hold | Swing | ||||
Elections in the 1950s
| Party | Candidate | Votes | % | ± | |
|---|---|---|---|---|---|
| Labour | George Thomas | 25,390 | 53.29 | ||
| Conservative | AL Hanninan | 22,258 | 46.71 | ||
| Majority | 3,132 | 6.57 | |||
| Turnout | 80.05 | ||||
| Labour hold | Swing | ||||
| Party | Candidate | Votes | % | ± | |
|---|---|---|---|---|---|
| Labour | George Thomas | 26,042 | 55.27 | ||
| Conservative | E Simons | 21,080 | 44.73 | ||
| Majority | 4,962 | 10.53 | |||
| Turnout | 76.69 | ||||
| Labour hold | Swing | ||||
| Party | Candidate | Votes | % | ± | |
|---|---|---|---|---|---|
| Labour | George Thomas | 28,995 | 55.13 | ||
| Conservative | AL Hallinan | 23,595 | 44.87 | ||
| Majority | 5,400 | 10.27 | |||
| Turnout | 84.11 | ||||
| Labour hold | Swing | ||||
| Party | Candidate | Votes | % | ± | |
|---|---|---|---|---|---|
| Labour | George Thomas | 27,200 | 54.30 | ||
| Conservative | CS Hallinan | 22,893 | 45.70 | ||
| Majority | 4,307 | 8.60 | |||
| Turnout | 82.23 | ||||
| Labour hold | Swing | ||||
See also
Notes and references
- ↑ "Cardiff West: Usual Resident Population, 2011". Neighbourhood Statistics. Office for National Statistics. Retrieved 20 February 2015.
- ↑ "Beyond 20/20 WDS - Table view". 2011 Electorate Figures. StatsWales. 1 December 2010. Retrieved 13 March 2011.
- ↑ "Cardiff West 1950-". Hansard 1803-2005. UK Parliament. Retrieved 2 February 2015.
- ↑ Leigh Rayment's Historical List of MPs – Constituencies beginning with "C" (part 2)
- ↑ "Election Data 2015". Electoral Calculus. Archived from the original on 17 October 2015. Retrieved 17 October 2015.
- ↑ http://www.bbc.co.uk/news/politics/constituencies/W07000079
- ↑ "Cardiff West result". Election results for Cardiff West. City of Cardiff Council. Retrieved 21 September 2015.
- ↑ "Election Data 2010". Electoral Calculus. Archived from the original on 17 October 2015. Retrieved 17 October 2015.
- ↑ Cardiff West BBC Election - Cardiff West
- ↑ "Election Data 2005". Electoral Calculus. Archived from the original on 15 October 2011. Retrieved 18 October 2015.
- ↑ "Election Data 2001". Electoral Calculus. Archived from the original on 15 October 2011. Retrieved 18 October 2015.
- ↑ "Election Data 1997". Electoral Calculus. Archived from the original on 15 October 2011. Retrieved 18 October 2015.
- ↑ "Election Data 1992". Electoral Calculus. Archived from the original on 15 October 2011. Retrieved 18 October 2015.
- ↑ "Politics Resources". Election 1992. Politics Resources. 9 April 1992. Retrieved 2010-12-06.
- ↑ "Election Data 1987". Electoral Calculus. Archived from the original on 15 October 2011. Retrieved 18 October 2015.
- ↑ "Election Data 1983". Electoral Calculus. Archived from the original on 15 October 2011. Retrieved 18 October 2015.
External links
- nomis Constituency Profile for Cardiff West — presenting data from the ONS annual population survey and other official statistics.
| Parliament of the United Kingdom | ||
|---|---|---|
| Preceded by Wirral |
Constituency represented by the Speaker 1976–1983 |
Succeeded by Croydon North East |
| About Cardiff |  | |
|---|---|---|
| Cardiff templates |
| |
| Neighbourhoods |
| |
Principal areas of Wales | ||