Bury Metropolitan Borough Council election, 2007
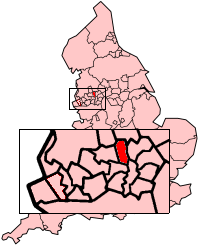
The Metropolitan Borough of Bury shown within England.
Elections to Bury Metropolitan Borough Council were held on 3 May 2007. One third of the council was up for election, and the council remained in No Overall Control, with the Conservative Party overtaking the Labour Party as the largest group.
After the election, the composition of the council was
- Conservative 23
- Labour 20
- Liberal Democrat 8
Election result
| Bury Local Election Result 2007 | ||||||||||
|---|---|---|---|---|---|---|---|---|---|---|
| Party | Seats | Gains | Losses | Net gain/loss | Seats % | Votes % | Votes | +/− | ||
| Conservative | 7 | 1 | 0 | +1 | 41.4 | 22,078 | -0.6 | |||
| Labour | 7 | 0 | 3 | -3 | 33.9 | 18,110 | +0.1 | |||
| Liberal Democrat | 3 | 1 | 0 | +1 | 18.4 | 9,814 | -3.2 | |||
| BNP | 5.9 | 3,162 | +5.9 | |||||||
| Independent | 0.3 | 180 | -2.2 | |||||||
Ward results
| Party | Candidate | Votes | % | ± | |
|---|---|---|---|---|---|
| Labour | Alan Matthews | 1,138 | 47.5 | +0.0 | |
| Conservative | Valerie Morris | 829 | 34.6 | +8.5 | |
| Liberal Democrat | Fiona Davison | 431 | 18.0 | +0.7 | |
| Majority | 309 | 12.9 | -8.4 | ||
| Turnout | 2,398 | ||||
| Labour hold | Swing | ||||
| Party | Candidate | Votes | % | ± | |
|---|---|---|---|---|---|
| Conservative | Jack Walton | 2,032 | 55.3 | -2.5 | |
| Labour | Ben Shatliff | 898 | 24.4 | +0.5 | |
| Liberal Democrat | Gaynor Clarkson | 386 | 10.5 | -7.8 | |
| BNP | Julie Kay | 359 | 9.8 | +9.8 | |
| Majority | 1,134 | 30.9 | -8.0 | ||
| Turnout | 3,675 | ||||
| Conservative hold | Swing | ||||
| Party | Candidate | Votes | % | ± | |
|---|---|---|---|---|---|
| Labour | Michael Connolly | 1,216 | 49.7 | -3.2 | |
| Conservative | Azmat Husain | 753 | 30.8 | +1.3 | |
| Liberal Democrat | Nissa Finney | 296 | 12.1 | -6.5 | |
| Independent | Ron Miles | 180 | 7.4 | +7.4 | |
| Majority | 463 | 18.9 | -4.5 | ||
| Turnout | 2,445 | ||||
| Labour hold | Swing | ||||
| Party | Candidate | Votes | % | ± | |
|---|---|---|---|---|---|
| Conservative | Denise Bigg | 1,555 | 52.3 | +4.6 | |
| Labour | Steven Treadgold | 936 | 31.5 | -2.2 | |
| Liberal Democrat | Robert Sloss | 485 | 16.3 | -3.3 | |
| Majority | 619 | 20.8 | +6.8 | ||
| Turnout | 2,976 | ||||
| Conservative hold | Swing | ||||
| Party | Candidate | Votes | % | ± | |
|---|---|---|---|---|---|
| Liberal Democrat | Wilf Davison | 1,661 | 54.6 | +2.6 | |
| Labour | Alan Quinn | 698 | 23.0 | -0.1 | |
| Conservative | Marilyn Vincent | 681 | 22.4 | -2.6 | |
| Majority | 963 | 31.7 | +4.7 | ||
| Turnout | 3,040 | ||||
| Liberal Democrat hold | Swing | ||||
| Party | Candidate | Votes | % | ± | |
|---|---|---|---|---|---|
| Labour | Keith Rothwell | 1,230 | 39.1 | +3.7 | |
| Conservative | Angela Crane | 1,077 | 34.2 | -6.0 | |
| Liberal Democrat | Victor Hagan | 505 | 16.0 | -8.4 | |
| BNP | Phillip Sedman | 336 | 10.7 | +10.7 | |
| Majority | 153 | 4.9 | |||
| Turnout | 3,148 | ||||
| Labour hold | Swing | ||||
| Party | Candidate | Votes | % | ± | |
|---|---|---|---|---|---|
| Conservative | David Higgin | 2,411 | 62.7 | +0.8 | |
| Labour | Roy Hardy | 753 | 19.6 | +1.0 | |
| Liberal Democrat | Ewan Arthur | 498 | 12.9 | -6.6 | |
| BNP | Jonathan Barbour | 184 | 4.8 | +4.8 | |
| Majority | 1,658 | 43.1 | +0.7 | ||
| Turnout | 3,846 | ||||
| Conservative hold | Swing | ||||
| Party | Candidate | Votes | % | ± | |
|---|---|---|---|---|---|
| Conservative | Peter Redstone | 1,828 | 61.3 | -0.4 | |
| Labour | Steve Perkins | 793 | 26.6 | -2.9 | |
| Liberal Democrat | Maureen Davison | 362 | 12.1 | +3.3 | |
| Majority | 1,035 | 34.7 | +2.4 | ||
| Turnout | 2,983 | ||||
| Conservative hold | Swing | ||||
| Party | Candidate | Votes | % | ± | |
|---|---|---|---|---|---|
| Labour | Siobhan Costello | 1,077 | 35.8 | -0.5 | |
| Conservative | Mat Hague | 972 | 32.3 | -6.5 | |
| BNP | Tom Rosser | 586 | 19.5 | +19.5 | |
| Liberal Democrat | Michael Halsall | 377 | 12.5 | -4.9 | |
| Majority | 105 | 3.5 | |||
| Turnout | 3,012 | ||||
| Labour hold | Swing | ||||
| Party | Candidate | Votes | % | ± | |
|---|---|---|---|---|---|
| Conservative | Stuart Penketh | 1,452 | 40.8 | -0.9 | |
| Labour | Daisy Johnston | 1,373 | 38.6 | -3.6 | |
| BNP | Peter Hallows | 477 | 13.4 | +13.4 | |
| Liberal Democrat | Emma Davison | 259 | 7.3 | -3.5 | |
| Majority | 79 | 2.2 | |||
| Turnout | 3,561 | ||||
| Conservative gain from Labour | Swing | ||||
| Party | Candidate | Votes | % | ± | |
|---|---|---|---|---|---|
| Labour | Tony Cummings | 1,299 | 50.3 | -4.6 | |
| Conservative | Bernard Slingsby | 582 | 22.6 | -9.0 | |
| BNP | Jean Purdy | 503 | 19.5 | +19.5 | |
| Liberal Democrat | Mary D'Albert | 196 | 7.6 | +7.6 | |
| Majority | 717 | 27.8 | +4.5 | ||
| Turnout | 2,580 | ||||
| Labour hold | Swing | ||||
| Party | Candidate | Votes | % | ± | |
|---|---|---|---|---|---|
| Conservative | Sheila Magnall | 1,766 | 55.7 | -0.6 | |
| Labour | Val Robinson | 1,007 | 31.8 | +1.8 | |
| Liberal Democrat | Janet Turner | 398 | 12.6 | -0.7 | |
| Majority | 759 | 23.9 | -2.3 | ||
| Turnout | 3,171 | ||||
| Conservative hold | Swing | ||||
| Party | Candidate | Votes | % | ± | |
|---|---|---|---|---|---|
| Labour | John Smith | 1,172 | 37.1 | -0.4 | |
| Conservative | Ijaz Ahmed | 1,074 | 34.0 | -1.8 | |
| Liberal Democrat | Bill Brison | 454 | 17.2 | -9.5 | |
| BNP | Eric Marshall | 372 | 11.8 | +11.8 | |
| Majority | 98 | 3.1 | +1.5 | ||
| Turnout | 3,163 | ||||
| Labour hold | Swing | ||||
| Party | Candidate | Votes | % | ± | |
|---|---|---|---|---|---|
| Liberal Democrat | Richard Baum | 1,424 | 43.0 | +1.0 | |
| Labour | Keith Grime | 1,102 | 33.2 | +5.0 | |
| Conservative | Stephen Morris | 789 | 23.8 | +0.9 | |
| Majority | 322 | 9.7 | -4.1 | ||
| Turnout | 3,315 | ||||
| Liberal Democrat gain from Labour | Swing | ||||
| Party | Candidate | Votes | % | ± | |
|---|---|---|---|---|---|
| Liberal Democrat | Steven Wright | 1,402 | 38.2 | -0.9 | |
| Conservative | Jonathan Grosskopf | 1,148 | 31.2 | +2.7 | |
| Labour | Gill Campbell | 1,124 | 30.6 | -1.8 | |
| Majority | 254 | 6.9 | +0.2 | ||
| Turnout | 3,674 | ||||
| Liberal Democrat gain from Labour | Swing | ||||
| Party | Candidate | Votes | % | ± | |
|---|---|---|---|---|---|
| Conservative | Ivonne Wright | 1,565 | 52.3 | -4.9 | |
| Labour | Jane Lewis | 726 | 24.3 | -1.3 | |
| Liberal Democrat | David Foss | 354 | 11.8 | -5.4 | |
| BNP | Stewart Clough | 345 | 11.5 | +11.5 | |
| Majority | 839 | 28.1 | -3.5 | ||
| Turnout | 2,990 | ||||
| Conservative hold | Swing | ||||
| Party | Candidate | Votes | % | ± | |
|---|---|---|---|---|---|
| Labour | Joan Grimshaw | 1,568 | 46.6 | +6.1 | |
| Conservative | Nicola Arnold | 1,564 | 46.5 | +4.0 | |
| Liberal Democrat | Theodor Tymczyna | 235 | 7.0 | -5.2 | |
| Majority | 4 | 0.1 | |||
| Turnout | 3,367 | ||||
| Labour hold | Swing | ||||
References
| Mayor | |
|---|---|
| Bolton | |
| Bury | |
| Manchester | |
| Oldham | |
| Rochdale | |
| Salford | |
| Stockport | |
| Tameside | |
| Trafford | |
| Wigan | |
| County Council |
|
| |
This article is issued from Wikipedia - version of the 10/4/2015. The text is available under the Creative Commons Attribution/Share Alike but additional terms may apply for the media files.