Arc diagram
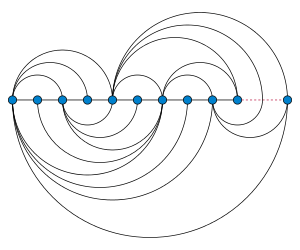
In graph drawing, an arc diagram is a style of graph drawing, in which the vertices of a graph are placed along a line in the Euclidean plane, with edges being drawn as semicircles in one of the two halfplanes bounded by the line, or as smooth curves formed by sequences of semicircles. In some cases, line segments of the line itself are also allowed as edges, as long as they connect only vertices that are consecutive along the line.
The use of the phrase "arc diagram" for this kind of drawings follows the use of a similar type of diagram by Wattenberg (2002) to visualize the repetition patterns in strings, by using arcs to connect pairs of equal substrings. However, this style of graph drawing is much older than its name, dating back to the work of Saaty (1964) and Nicholson (1968), who used arc diagrams to study crossing numbers of graphs. An older but less frequently used name for arc diagrams is linear embeddings.[1]
Heer, Bostock & Ogievetsky (2010) write that arc diagrams "may not convey the overall structure of the graph as effectively as a two-dimensional layout", but that their layout makes it easy to display multivariate data associated with the vertices of the graph.
Planar graphs

As Nicholson (1968) observed, every embedding of a graph in the plane may be deformed into an arc diagram, without changing its number of crossings. In particular, every planar graph has a planar arc diagram. However, this embedding may need to use more than one semicircle for some of its edges.
If a graph is drawn without crossings using an arc diagram in which each edge is a single semicircle, then the drawing is a two-page book embedding, something that is only possible for the subhamiltonian graphs, a subset of the planar graphs.[2] For instance, a maximal planar graph has such an embedding if and only if it contains a Hamiltonian cycle. Therefore, a non-Hamiltonian maximal planar graph such as the Goldner–Harary graph cannot have a planar embedding with one semicircle per edge. Testing whether a given graph has a crossing-free arc diagram of this type (or equivalently, whether it has pagenumber two) is NP-complete.[3]
However, every planar graph has an arc diagram in which each edge is drawn as a biarc with at most two semicircles. More strongly, every st-planar directed graph (a planar directed acyclic graph with a single source and a single sink, both on the outer face) has an arc diagram in which every edge forms a monotonic curve, with these curves all consistently oriented from one end of the vertex line towards the other.[4] For undirected planar graphs, one way to construct an arc diagram with at most two semicircles per edge is to subdivide the graph and add extra edges so that the resulting graph has a Hamiltonian cycle (and so that each edge is subdivided at most once), and to use the ordering of the vertices on the Hamiltonian cycle as the ordering along the line.[5]
Minimizing crossings
Because it is NP-complete to test whether a given graph has an arc diagram with one semicircle per edge and no crossings, it is also NP-hard to find an arc diagram of this type that minimizes the number of crossings. This crossing minimization problem remains NP-hard, for non-planar graphs, even if the ordering of the vertices along the line is fixed.[1] However, in the fixed-ordering case, an embedding without crossings (if one exists) may be found in polynomial time by translating the problem into a 2-satisfiability problem, in which the variables represent the placement of each arc and the constraints prevent crossing arcs from being placed on the same side of the vertex line.[6] Additionally, in the fixed-ordering case, a crossing-minimizing embedding may be approximated by solving a maximum cut problem in an auxiliary graph that represents the semicircles and their potential crossings (or equivalently, by approximating the MAX2SAT version of the 2-satisfiability instance).[7]
Cimikowski & Shope (1996), Cimikowski (2002), and He, Sýkora & Vrt'o (2005) discuss heuristics for finding arc diagrams with few crossings.
Clockwise orientation
For drawings of directed graphs, a common convention is to draw each arc in a clockwise direction, so that arcs that are directed from an earlier to a later vertex in the sequence are drawn above the vertex line, and arcs directed from a later to an earlier vertex are drawn below the line. This clockwise orientation convention was developed as part of a different graph drawing style by Fekete et al. (2003), and applied to arc diagrams by Pretorius & van Wijk (2007).
Other uses
Arc diagrams were used by Brandes (1999) to visualize the state diagram of a shift register, and by Djidjev & Vrt'o (2002) to show that the crossing number of every graph is at least quadratic in its cutwidth.
Notes
- 1 2 Masuda et al. (1990).
- ↑ The application of semicircles to edge layout in book embeddings was already made by Bernhart & Kainen (1979), but the explicit connection of arc diagrams with two-page book embeddings seems tp be due to Masuda et al. (1990).
- ↑ Chung, Leighton & Rosenberg (1987).
- ↑ Giordano et al. (2007).
- ↑ Bekos et al. (2013).
- ↑ Efrat, Erten & Kobourov (2007).
- ↑ Cimikowski & Mumey (2007).
References
- Bekos, Michael A.; Kaufmann, Michael; Kobourov, Stephen G.; Symvonis, Antonios (2013), "Smooth orthogonal layouts", Graph Drawing: 20th International Symposium, GD 2012, Redmond, WA, USA, September 19–21, 2012, Revised Selected Papers, Lecture Notes in Computer Science, 7704, Springer, pp. 150–161, doi:10.1007/978-3-642-36763-2_14.
- Bernhart, Frank R.; Kainen, Paul C. (1979), "The book thickness of a graph", Journal of Combinatorial Theory, Series B, 27 (3): 320–331, doi:10.1016/0095-8956(79)90021-2.
- Brandes, Ulrik (1999), "Hunting down Graph B", Graph Drawing: 7th International Symposium, GD’99, Štiřín Castle, Czech Republic September 15–19, 1999, Proceedings, Lecture Notes in Computer Science, 1731, Springer, pp. 410–415, doi:10.1007/3-540-46648-7_42.
- Chung, Fan R. K.; Leighton, Frank Thompson; Rosenberg, Arnold L. (1987), "Embedding graphs in books: A layout problem with applications to VLSI design" (PDF), SIAM Journal on Algebraic and Discrete Methods, 8 (1): 33–58, doi:10.1137/0608002.
- Cimikowski, Robert (2002), "Algorithms for the fixed linear crossing number problem", Discrete Applied Mathematics, 122 (1-3): 93–115, doi:10.1016/S0166-218X(01)00314-6, MR 1907825.
- Cimikowski, Robert; Mumey, Brendan (2007), "Approximating the fixed linear crossing number", Discrete Applied Mathematics, 155 (17): 2202–2210, doi:10.1016/j.dam.2007.05.009, MR 2360650.
- Cimikowski, Robert; Shope, Paul (1996), "A neural-network algorithm for a graph layout problem", IEEE Transactions on Neural Networks, 7 (2): 341–345, doi:10.1109/72.485670.
- Djidjev, Hristo; Vrt'o, Imrich (2002), "An improved lower bound for crossing numbers", Graph Drawing: 9th International Symposium, GD 2001, Vienna, Austria, September 23–26, 2001, Revised Papers, Lecture Notes in Computer Science, 2265, Springer, pp. 96–101, doi:10.1007/3-540-45848-4_8.
- Efrat, Alon; Erten, Cesim; Kobourov, Stephen G. (2007), "Fixed-location circular arc drawing of planar graphs", Journal of Graph Algorithms and Applications, 11 (1): 145–164, doi:10.7155/jgaa.00140.
- Fekete, Jean-Daniel; Wang, David; Dang, Niem; Aris, Aleks; Plaisant, Catherine (2003), "Overlaying graph links on treemaps", IEEE Symp. on Information Visualization, Poster Compendium, pp. 82–83.
- Giordano, Francesco; Liotta, Giuseppe; Mchedlidze, Tamara; Symvonis, Antonios (2007), "Computing upward topological book embeddings of upward planar digraphs", Algorithms and Computation: 18th International Symposium, ISAAC 2007, Sendai, Japan, December 17-19, 2007, Proceedings, Lecture Notes in Computer Science, 4835, Springer, pp. 172–183, doi:10.1007/978-3-540-77120-3_17.
- He, Hongmei; Sýkora, Ondrej; Vrt'o, Imrich (2005), "Crossing Minimisation Heuristics for 2-page Drawings", Electronic Notes in Discrete Mathematics, 22: 527–534, doi:10.1016/j.endm.2005.06.088.
- Heer, Jeffrey; Bostock, Michael; Ogievetsky, Vadim (2010), "A tour through the visualization zoo", Communications of the ACM, 53 (6): 59–67, doi:10.1145/1743546.1743567.
- Masuda, Sumio; Nakajima, Kazuo; Kashiwabara, Toshinobu; Fujisawa, Toshio (1990), "Crossing minimization in linear embeddings of graphs", IEEE Transactions on Computers, 39 (1): 124–127, doi:10.1109/12.46286, MR 1032144.
- Nicholson, T. A. J. (1968), "Permutation procedure for minimising the number of crossings in a network", Proceedings of the Institution of Electrical Engineers, 115: 21–26, doi:10.1049/piee.1968.0004, MR 0311416.
- Pretorius, A. J.; van Wijk, J. J. (2007), "Bridging the semantic gap: Visualizing transition graphs with user-defined diagrams", IEEE Computer Graphics and Applications, 27 (5): 58–66, doi:10.1109/MCG.2007.121.
- Saaty, Thomas L. (1964), "The minimum number of intersections in complete graphs", Proceedings of the National Academy of Sciences of the United States of America, 52: 688–690, doi:10.1073/pnas.52.3.688, MR 0166772.
- Wattenberg, M. (2002), "Arc diagrams: visualizing structure in strings", Proc. IEEE Symposium o nInformation Visualization (INFOVIS 2002), pp. 110–116, doi:10.1109/INFVIS.2002.1173155.