2014–15 Australian region cyclone season
 | |
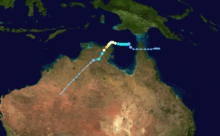
| Season summary map | |
| First system formed | 3 December 2014 |
|---|---|
| Last system dissipated | 5 July 2015 (record latest) |
| Strongest storm1 | Marcia – 930 hPa (mbar), 205 km/h (125 mph) (10-minute sustained) |
| Tropical lows | 17 |
| Tropical cyclones | 9 |
| Severe tropical cyclones | 7 |
| Total fatalities | 1 total |
| Total damage | $732 million (2015 USD) |
| 1Strongest storm is determined by lowest pressure | |
2012–13, 2013–14, 2014–15, 2015–16, 2016–17 | |
| Related articles | |
The 2014–15 Australian region cyclone season is the period of the year when most tropical cyclones form within the Southern Indian Ocean and Pacific Oceans between 90°E and 160°E. The season officially ran from November 1, 2014 to April 30, 2015, however a tropical cyclone could form at any time between July 1, 2014 and June 30, 2015 and would count towards the season total. During the season, tropical cyclones will be officially monitored, by one of the five Tropical Cyclone Warning Centres (TCWCs) that are operated in this region.
Three of the five centres are operated by the Australian Bureau of Meteorology (BoM) in Perth, Darwin, and Brisbane, while the other two are operated by the National Weather Service of Papua New Guinea in Port Moresby and the Indonesian Agency for Meteorology, Climatology and Geophysics in Jakarta, Indonesia. The United States Joint Typhoon Warning Center (JTWC) and other national meteorological services including Météo-France also monitored the basin during the season.
Seasonal forecasts
| Region | Chance of more |
Average number |
Actual activity |
|---|---|---|---|
| Whole | 34% | 11 | 8 |
| Western | 43% | 7 | 3 |
| North-Western | 38% | 5 | 0 |
| Northern | 46% | 3 | 2 |
| Eastern | 42% | 4 | 3 |
| Southern Pacific | 48% | 15 | 9 |
| Western South Pacific | 56% | 8 | 7 |
| Eastern South Pacific | 47% | 11 | 2 |
| Source: BOM's Seasonal Outlooks for Tropical Cyclones.[1][2] | |||
Ahead of the cyclone season, the Australian Bureau of Meteorology (BoM), the New Zealand National Institute of Water and Atmospheric Research (NIWA) and various other Pacific Meteorological services, all contributed towards the Island Climate Update tropical cyclone outlook that was released during October 2014.[3] The outlook took into account the ENSO neutral conditions that had been observed across the Pacific and analogue seasons that had ENSO neutral and weak El Niño conditions occurring during the season.[3] The outlook called for a near average number of tropical cyclones for the 2014–15 season, with eight to twelve named tropical cyclones, to occur between 135°E and 120°W compared to an average of 10.[3] At least four of the tropical cyclones were expected to become category 3 severe tropical cyclones, while three could become category 4 severe tropical cyclones, they also noted that a Category 5 severe tropical cyclone was unlikely to occur.[3]
In addition to contributing towards the Island Climate Update outlook, the BoM issued eight seasonal forecasts during October 2014, for the Australian region and the Southern Pacific with each forecast covering the whole tropical cyclone year.[1] Each forecast issued took into account the near El Niño conditions that had developed over the region and the El Niño episode that was expected to develop during the season.[1] For the basin as a whole they predicted that there was a 34% chance, that the season would be near its average of around 11 tropical cyclones.[1] For the Western region between 90°E and 125°E, the BoM forecast that the area would see activity near to the average of 7, with a 43% chance of an above average cyclone season.[1] TCWC Perth also noted that there was a likelihood of two tropical cyclones and a significant likelhood of at least one severe tropical cyclone impacting Western Australia.[4]
For the North-Western subregion between 105°E and 130°E, it was predicted that activity would be below average, with a 38% chance of above average tropical cyclone activity.[1] The Northern Territory which was defined as being between as being 125°E and 142.5°E had a 46% chance of an above average season, with TCWC Darwin noting that all of the climate drivers were pointing towards a typical tropical cyclone season for Northern Australia.[1][5] The Eastern region between 142.5°E and 160°E was predicted to have a near normal tropical cyclone season, though it was noted that there was a possibility of a delayed start to the season.[1][6] The BoM also issued 3 seasonal forecasts for the Southern Pacific between 142.5°E and 120°W, one for the Western Southern Pacific region between 142.5°E and 165°E and one for the Eastern Southern Pacific region between 165°E and 120°W.[2] They predicted that the region as a whole, would experience near average tropical cyclone activity during the coming season with a 55% chance of it being above average.[2] The Western region was predicted to have 39% chance of being above average while the Eastern region had a 55% chance of being above average.[2]
An updated Island Climate Update tropical cyclone outlook was issued during February 2015, which suggested that near normal activity was still possible.[7] The outlook took into account Tropical Cyclones Niko and Ola as well as the weak El Nino conditions, that were predicted to persist over the region.[7] As a result, the update predicted that an additional six to eight named tropical cyclones would develop over the basin, which would bring the overall total to between eight and ten tropical cyclones.[7] The update also predicted that at least four tropical cyclones would intensify into category three severe tropical cyclones, of which three could intensify and become either a category four or five severe tropical cyclone.[7]
Seasonal summary

Storms
Tropical Cyclone Bakung
| Category 2 tropical cyclone (Australian scale) | |||
|---|---|---|---|
| Tropical storm (SSHWS) | |||
| |||
| Duration | 10 December – 13 December | ||
| Peak intensity | 95 km/h (60 mph) (10-min) 991 hPa (mbar) | ||


During 10 December a tropical low developed about 535 km (330 mi) to the north-east of the Cocos (Keeling) Islands.[8] The system had developed within a favourable environment for further development, with low to moderate vertical wind shear and a good poleward outflow which was being enhanced by a trough of low pressure.[9] Over the next day the system gradually intensified/developed further, with atmospheric convection deepening near the systems centre.[10] TCWC Jakarta subsequently named the low Bakung during 11 December, as it was thought that the system had become a Category 2 tropical cyclone on the Australian Scale.[11][12] At the same time TCWC Jakarta reported that Bakung had peaked with 10-minute sustained windspeeds of 95 km/h (60 mph), before the JTWC initiated advisories on the system later that day and designated it Tropical Cyclone 03S.[11][13]
During 12 December TCWC Jakarta reported that the system had weakened into a Category 1 tropical cyclone, while the JTWC reported that the system had intensified slightly and reached its peak intensity with 1-minute sustained windspeeds of 65 km/h (40 mph).[14][15] Early the next day as Tropical Cyclone Bakung continued to move westwards, it moved out of the Australian region and into the South-West Indian Ocean.[16][17] However, during that day the system's low level circulation centre became exposed and displaced about 280 km (175 mi) from the deep convection.[16][18] As a result, TCWC Jakarta and the JTWC issued their final warnings on the system, while RSMC La Reunion declared it to be a remnant low in their one and only warning on the system.[17][18][19]
Severe Tropical Cyclone Kate
| Category 4 severe tropical cyclone (Australian scale) | |||
|---|---|---|---|
| Category 3 tropical cyclone (SSHWS) | |||
| |||
| Duration | 21 December – 30 December (Exited basin) | ||
| Peak intensity | 165 km/h (105 mph) (10-min) 952 hPa (mbar) | ||


On 21 December TCWC Perth reported that Tropical Low 04U had developed within the monsoon trough to the southeast of Sumatra, Indonesia.[20][21] Over the next few days the system gradually developed further as it moved south-eastwards, before it started to move towards the south-west and the Cocos (Keeling) Islands during 23 December.[20] Early the next day, it intensified into a Category 1 tropical cyclone, as BOM named the system Kate. The next day, Kate continued to intensified as an eye developed and reached peak intensity as a Category 4 severe tropical cyclone as. On 27 December, it underwent an eyewall replacement cycle. On 30 December, TCWC Perth reported that Kate had moved out of the Australian region and into the South-west Indian Ocean basin.
Tropical Low 05U
| Tropical low (Australian scale) | |||
|---|---|---|---|
| |||
| Duration | 2 January – 10 January | ||
| Peak intensity | Winds not specified | ||


On 2 January TCWC Perth and Darwin started to monitor Tropical Low 05U, that had developed within the monsoon trough near Wyndham in the Kimberley region of Western Australia.[22][23][23] Over the next few days the low moved slowly westwards and was forecast to possibly move over open water and develop into a tropical cyclone.
Tropical Low 07U
| Tropical low (Australian scale) | |||
|---|---|---|---|
| |||
| Duration | 10 January – 13 January | ||
| Peak intensity | 55 km/h (35 mph) (10-min) 998 hPa (mbar) | ||


On 10 January, the BoM started to monitor a tropical low south of the Solomon Islands
Severe Tropical Cyclone Lam
| Category 4 severe tropical cyclone (Australian scale) | |||
|---|---|---|---|
| Category 3 tropical cyclone (SSHWS) | |||
| |||
| Duration | 12 February – 20 February | ||
| Peak intensity | 185 km/h (115 mph) (10-min) 943 hPa (mbar) | ||

On 13 February, the BoM started to monitor a weak tropical disturbance over the Gulf of Carpentaria. During the next few days, the disturbance gradually developed and as it was located 200 kilometres (120 mi) northwest of Weipa, Queensland on 16 February. On 19 February and due to a developing, clear eye, the JTWC upgraded Lam to a Category 2 while the BoM upgraded it to a Category 4.
Severe Tropical Cyclone Marcia
| Category 5 severe tropical cyclone (Australian scale) | |||
|---|---|---|---|
| Category 4 tropical cyclone (SSHWS) | |||
| |||
| Duration | 15 February – 26 February | ||
| Peak intensity | 205 km/h (125 mph) (10-min) 930 hPa (mbar) | ||


On 16 February, the BoM started to monitor a weak tropical disturbance in the Coral Sea. It developed into a Category 1 tropical cyclone on 18 February and was named Marcia. It was upgraded to Category 2 the following day when it was approximately 555 kilometres (345 mi) north of Bundaberg and again upgraded to Category 3 severe tropical cyclone when approximately 290 kilometres (180 mi) north of Yeppoon. On 19 February and due to a developing, clear eye, the JTWC upgraded Marcia to a Category 2 whilst the BoM upgraded it as a Category 4. Due to explosive intensification, Marcia became a Category 5 according to the BoM early on 20 February.
The boat of two fishermen travelling to Fraser Island sank due to rough seas on the morning of 19 February, however, they were found safe and well on nearby Moon Boom Island the next morning.[24] The storm wrought extensive damage in Queensland, with losses amounting to A$750 million (US$590.5 million).[25]
Severe Tropical Cyclone Olwyn
| Category 3 severe tropical cyclone (Australian scale) | |||
|---|---|---|---|
| Category 2 tropical cyclone (SSHWS) | |||
| |||
| Duration | 8 March – 14 March | ||
| Peak intensity | 150 km/h (90 mph) (10-min) 960 hPa (mbar) | ||


On 8 March, the BoM started to monitor a weak tropical low over Western Australia. The system was later designated as 16U a few days later. Due to an increase in convection, both the BoM and JTWC upgraded the system to a Category 1 tropical cyclone, naming it Olwyn on 11 March. Just before 12 March, Olwyn rapidly developed a ragged eye, as the BoM upgraded the system to a Category 3 severe tropical cyclone. Early on 13 March, Olwyn reached its peak strength as the JTWC classified it as a Category 2 cyclone. However, JTWC downgraded it to a Category 1 cyclone after a few hours. Late on the same day, Olwyn made landfall over southwestern Australia.
Olwyn caused extensive damage along the coast of Western Australia, from Onslow to Kalbarri. In preparation for the storm, the Pilbara Ports authority closed the ports of Dampier and Ashburton.[26] The entire workforce on Barrow Island was evacuated to the island's cyclone shelter. 128 km/h (80 mph) wind gusts and 141.6 mm (5.57 in) of rain was recorded on the island as it was brushed by Olwyn.[27] Upon landfall, a maximum wind gust of 180 km/h (110 mph) was recorded at Learmonth.[28] Moderate property damage occurred at nearby Exmouth, with several houses being inundated with floodwater after 141.8 mm (5.58 in) of rain fell in 24 hours.[26] Trees were uprooted and power was cut for several days.[26][29] The Exmouth Yacht Club sustained heavy damage from Olwyn's storm surge.[26] Damage was more severe further south at Carnarvon where most houses are not built to cyclone standards, unlike in Exmouth.[29] Olwyn passed over the town at category 3 status, un-roofing and severely damaging multiple houses, while many sheds and out-buildings were totally destroyed.[29][30] The town's water and power facilities were damaged, leaving the area without water and electricity supplies for days.[30] The entire banana crop in the Carnarvon area was destroyed by the storm's high winds and flooding.[30] The Gascoyne River experienced its most severe flood since 2010 due to rains from Olwyn.[30] One person sustained life-threatening injuries in a storm-related car accident. Total damage in Carnarvon was estimated to be in excess of A$100 million (US$76.1 million),[31] and Olwyn has been noted as the most severe cyclone to have hit the town since 1950.[29]
A total of 121.8 mm (4.80 in) of rain fell in 24 hours at Shark Bay from Olwyn, setting a record for the highest amount of rainfall recorded in March at what is normally the most arid place on the Australian coast.[32] Minor property and tree damage occurred in Denham.[29] Further south, 8 mm (0.31 in) of rain and 76 km/h (47 mph) wind gusts were reported in Geraldton.[33] The remnant low of Olwyn caused 15 mm (0.59 in) - 25 mm (0.98 in) of rain across the wheat belt, which was beneficial for farmers in the area. Perth recorded 12.8 mm (0.50 in) of rain and cooler temperatures as Olwyn's remnants moved into the Southern Ocean. Olwyn hit Carnarvon, Geraldton and the Wheatbelt on the same date when Cyclone Hazel hit Carnarvon, Geraldton and the Wheatbelt and dissipated on 14 March 1979. Olwyn was expected to bring more than 60 millimeters of rain to Perth. On 15 March Olwyn's remnants bought severe storms to the Southern Western Australia. Olwyn was the first ex-tropical cyclone to hit Geraldton, Jurien Bay, Wheatbelt and Perth since Cyclone Iggy in 2012 and Cyclone Bianca in 2011.[34]
Severe Tropical Cyclone Nathan
| Category 4 severe tropical cyclone (Australian scale) | |||
|---|---|---|---|
| Category 2 tropical cyclone (SSHWS) | |||
| |||
| Duration | 9 March – 25 March | ||
| Peak intensity | 165 km/h (105 mph) (10-min) 963 hPa (mbar) | ||


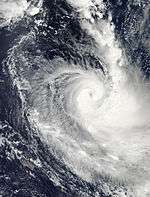
Shortly after Cyclone Pam was classified, the outer rainbands of Pam led to the formation of a tropical low near Australia on 9 March. Later that day, the BoM designated the system as 17U and intensified into Tropical Cyclone Nathan several hours later. It slowly executed a cyclonic loop over the next few days, moving across Arnhem Land.[35] After intensifying to an initial peak intensity of 165 km/h (105 mph), Nathan weakened while crossing the Cape York Peninsula and reintensified over the Gulf of Carpentaria. Nathan brought 106.0mm of rainfall to Onslow on 30 March. Cyclone Nathan hit the Arnhem Land one month after Cyclone Lam.
Severe Tropical Cyclone Ikola
| Category 4 severe tropical cyclone (Australian scale) | |||
|---|---|---|---|
| Category 3 tropical cyclone (SSHWS) | |||
| |||
| Duration | 6 April (Entered basin) – 8 April | ||
| Peak intensity | 175 km/h (110 mph) (10-min) 951 hPa (mbar) | ||

On 6 April, the BoM had reported that Ikola had entered the basin as a severe tropical cyclone and was designated as 19U. Ikola rapidly weakened to become a trough system, bringing heavy rainfall to the southwestern parts of Western Australia and severe storms to the southeast of Western Australia. Ikola soaked Central Western Australia and affected Perth from 6-10 April. Ikola was also the first cyclone to move into the Australian basin from the Southwest Indian Ocean basin since Cyclone Alenga in the 2011-12 season.
Severe Tropical Cyclone Quang
| Category 4 severe tropical cyclone (Australian scale) | |||
|---|---|---|---|
| Category 4 tropical cyclone (SSHWS) | |||
| |||
| Duration | 27 April – 1 May | ||
| Peak intensity | 195 km/h (120 mph) (10-min) 945 hPa (mbar) | ||


On 27 April, the BoM started to monitor a tropical low over Western Australia. Later that day, the system gradually intensified as it was designated as 21U. The next day, 21U intensified into Tropical Cyclone Quang. Quang hit the Exmouth coast on the night of 1 May and quickly weakened to a tropical low after it hit Exmouth. Quang did minimal damage to Exmouth, Western Australia. The name Quang was retired and relaced with the name Quincey.
Tropical Cyclone Raquel
| Category 1 tropical cyclone (Australian scale) | |||
|---|---|---|---|
| Tropical storm (SSHWS) | |||
| |||
| Duration | 30 June (Entered basin) – 5 July | ||
| Peak intensity | 65 km/h (40 mph) (10-min) 995 hPa (mbar) | ||


Late on 30 June, Tropical Depression 17F moved into the Australian region from the South Pacific and intensified into Tropical Cyclone Raquel. After drifting for the next two days, it exited the basin, moving back into the South Pacific. However Raquel re-entered the basin early on 4 July. The next day, Raquel was declared a remnant low.
According to the Bureau of Meteorology, it is the only known instance of a tropical cyclone during July in the region since the satellite era began (since at least 1970).[36] As a byproduct of becoming a tropical cyclone on the first day of the new cyclone year, it marked the earliest start to a season in the basin on record.[37]
Other systems
On 3 December TCWC Perth reported that Tropical Low 01U had developed over open water to the south-west of Cocos (Keeling) Islands, after various applications of the Dvorak technique had produced results between T2.0 and T3.0.[38] They also reported that the low could develop into a tropical cyclone during the following six to twelve hours, however, TCWC Perth issued its final advisory on the system during the next day as the system was not likely to develop into a tropical cyclone and had started weakening.[39][40] On 13 December TCWC Perth reported that a tropical low had developed, to the south of the Indonesian island of Java.[41] Conditions surrounding the system were unfavourable for further development over the next few days, however TCWC Perth thought that there was a small chance that conditions could improve.[41][42] Over the next few days the system moved south-westwards, before it was last noted on 15 December, as it was not expected to develop further.[42][43] On 10 January, TCWC Brisbane reported that Tropical Low 06U had developed within the monsoon trough, within an unfavorable environment for further development to the northeast of Queensland.[44] Over the next couple of days the system moved southeastwards and may have influenced the track of Tropical Low 07U, before it was last noted during 13 January.[45][46]
During 17 January, a tropical low that had been monitored by the BoM for a few days, moved into the Northern Kimberley region from the Northern Territory.[47] Over the next couple of days the system moved south-westwards over land, before it moved offshore and into the Indian Ocean near Broome during 19 January.[47] As computer models were predicting conditions surrounding the low to be marginally favourable for further development, TCWC Perth expected the system to develop into a tropical cyclone and issued tropical cyclone advices for coastal areas from Kuri Bay to Exmouth.[47] However, as the system spent more time over land than had been forecasted and vertical wind shear did not weaken as much as forecasted.[47] As a result, the system failed to develop into a tropical cyclone as it moved south-westwards towards the Pilbara coast, before it dissipated near Port Headland during 20 January.[47]
On 13 February, a tropical low developed roughly 700 km (430 mi) southwest of the Cocos (Keeling) Islands. The BoM stopped warning on it late on 16 February as it moved in a southerly direction.
Season effects
| Name | Dates active | Peak classification |
Sustained wind speeds |
Pressure | Land areas affected | Damages (AUD) |
Damages (USD) |
Deaths | Refs |
|---|---|---|---|---|---|---|---|---|---|
| 01U | 3 – 4 December | Tropical low | 55 km/h (35 mph) | 1000 hPa (29.53 inHg) | None | None | None | None | |
| Bakung | 10 – 13 December | Category 2 tropical cyclone | 95 km/h (60 mph) | 991 hPa (29.26 inHg) | Indonesia | None | None | None | |
| Low | 13 – 15 December | Tropical low | Not specified | Not Specified | None | None | None | None | |
| Kate | 21 – 30 December | Category 4 severe tropical cyclone | 165 km/h (105 mph) | 952 hPa (28.11 inHg) | Cocos (Keeling) Islands | Minimal | Minimal | None | [20] |
| 05U | 2 – 10 January | Tropical low | Not specified | Not Specified | Western Australia | Minimal | Minimal | None | [23] |
| 06U | 10 – 13 January | Tropical low | Not specified | Not Specified | None | None | None | None | |
| 07U | 10 – 13 January | Tropical low | 55 km/h (35 mph) | 998 hPa (29.47 inHg) | Solomon Islands | None | None | None | |
| Low | 16 – 20 January | Tropical low | 30 km/h (15 mph) | 1003 hPa (29.62 inHg) | Western Australia | None | None | None | |
| Low | 13 – 16 February | Tropical low | Not Specified | Not Specified | None | None | None | None | |
| Lam | 13 – 20 February | Category 4 severe tropical cyclone | 185 km/h (115 mph) | 943 hPa (27.85 inHg) | Queensland, Northern Territory, Western Australia | $82.6 million | $64.4 million | None | [48] |
| Marcia | 15 – 26 February | Category 5 severe tropical cyclone | 205 km/h (125 mph) | 930 hPa (27.46 inHg) | Queensland | $750 million | $591 million | None | |
| Olwyn | 8 – 14 March | Category 3 severe tropical cyclone | 150 km/h (90 mph) | 960 hPa (28.35 inHg) | Western Australia | $100 million | $76.1 million | None | |
| Nathan | 9 – 25 March | Category 4 severe tropical cyclone | 165 km/h (105 mph) | 963 hPa (28.44 inHg) | Queensland, Northern Territory, Western Australia | Major | Major | None | |
| Ikola | 6 – 8 April | Category 4 severe tropical cyclone | 175 km/h (110 mph) | 951 hPa (28.08 inHg) | None | None | None | None | |
| Quang | 27 April – 1 May | Category 4 severe tropical cyclone | 195 km/h (120 mph) | 945 hPa (27.91 inHg) | Western Australia | Minimal | Minimal | None | |
| Low | 12 – 14 May | Tropical low | Not specified | Not specified | Solomon Islands | None | None | None | |
| Raquel | 30 June – 5 July | Category 1 tropical cyclone | 65 km/h (40 mph) | 995 hPa (29.38 inHg) | Solomon Islands | Minimal | Minimal | 1 | |
| Season Aggregates | |||||||||
| 17 systems | 3 December – 5 July | 205 km/h (125 mph) | 930 hPa (27.46 inHg) | $933 million | $732 million | 1 | |||
See also
- List of Southern Hemisphere cyclone seasons
- Atlantic hurricane seasons: 2014, 2015
- Pacific hurricane seasons: 2014, 2015
- Pacific typhoon seasons: 2014, 2015
- North Indian Ocean cyclone seasons: 2014, 2015
- 2014–15 South-West Indian Ocean cyclone season
- 2014–15 South Pacific cyclone season
- South Atlantic tropical cyclone
References
- 1 2 3 4 5 6 7 8 National Climate Centre (13 October 2014). "2014–2015 Australian Tropical Cyclone Season Outlook". Australian Bureau of Meteorology. Retrieved 13 October 2014.
- 1 2 3 4 National Climate Centre (15 October 2014). "2014–2015 South Pacific Tropical Cyclone Season Outlook". Australian Bureau of Meteorology. Archived from the original on 16 October 2013. Retrieved 15 October 2014.
- 1 2 3 4 "Southwest Pacific Tropical Cyclone Outlook: Near average tropical cyclone numbers for the region is likely, with increased activity from February onward". The National Institute of Water and Atmospheric Research. 15 October 2014. Retrieved 22 October 2014.
- ↑ Perth Tropical Cyclone Warning Centre (13 October 2014). "Western Australia Seasonal Tropical Cyclone Outlook". Australian Bureau of Meteorology. Archived from the original on 13 October 2014. Retrieved 13 October 2014.
- ↑ Darwin Tropical Cyclone Warning Centre (14 October 2013). "Tropical Cyclone Seasonal Outlook for the Northern Territory". Australian Bureau of Meteorology. Archived from the original on 16 January 2014. Retrieved 16 January 2014.
- ↑ "Tropical Cyclone Seasonal Outlook for The Coral Sea". Australian Bureau of Meteorology. 13 October 2014. Archived from the original on 13 October 2014. Retrieved 13 October 2014.
- 1 2 3 4 "Southwest Pacific Tropical Cyclone Outlook Update". National Institute of Water and Atmospheric Research. 9 February 2015. Archived from the original on 18 March 2015. Retrieved March 18, 2015.
- ↑ "Tropical Cyclone Outlook for the Western Region 10 December 2014". Australian Bureau of Meteorology. 10 December 2014. Archived from the original on 19 December 2014. Retrieved 1 January 2015.
- ↑ Joint Typhoon Warning Center. "Tropical Cyclone Formation Alert 11 December 2014 02:30z". United States Navy, United States Airforce. Archived from the original on 19 December 2014. Retrieved 1 January 2015.
- ↑ RSMC La Reunion Tropical Cyclone Center (11 December 2014). Bulletin for Cyclonic Activity and Significant Tropical Weather in the Southwest Indian Ocean 11 December 2014 12:06 UTC 2015 (PDF) (Report). Météo-France. Archived (PDF) from the original on 1 January 2015. Retrieved 1 January 2015.
- 1 2 Jakarta Tropical Cyclone Warning Centre (11 December 2014). "Ocean Gale and Storm Warning 11 December 2014 14:46 UTC". Indonesian Agency for Meteorology, Climatology and Geophysics. Archived from the original on 1 January 2015. Retrieved 1 January 2015.
- ↑ RSMC La Reunion Tropical Cyclone Center (12 December 2014). Bulletin for Cyclonic Activity and Significant Tropical Weather in the Southwest Indian Ocean 12 December 2014 12:06 UTC (PDF) (Report). Météo-France. Archived (PDF) from the original on 1 January 2015. Retrieved 1 January 2015.
- ↑ Joint Typhoon Warning Center (11 December 2014). "Tropical Cyclone 03S (Bakung) Warning 11 December 2014 21:00z". United States Navy, United States Airforce. Archived from the original on 19 December 2014. Retrieved 1 January 2015.
- ↑ Jakarta Tropical Cyclone Warning Centre (12 December 2014). "Ocean Gale and Storm Warning 12 December 2014 01:29 UTC". Indonesian Agency for Meteorology, Climatology and Geophysics. Archived from the original on 1 January 2015. Retrieved 1 January 2015.
- ↑ Joint Typhoon Warning Center (12 December 2014). "Tropical Cyclone 03S (Bakung) Warning 12 December 2014 09:00z". United States Navy, United States Airforce. Archived from the original on 19 December 2014. Retrieved 1 January 2015.
- 1 2 RSMC La Reunion Tropical Cyclone Center (13 December 2014). Bulletin for Cyclonic Activity and Significant Tropical Weather in the Southwest Indian Ocean 13 December 2014 12:06 UTC (PDF) (Report). Météo-France. Archived (PDF) from the original on 1 January 2015. Retrieved 1 January 2015.
- 1 2 Jakarta Tropical Cyclone Warning Centre (13 December 2014). "Ocean Gale and Storm Warning 13 December 2014 02:02 UTC". Indonesian Agency for Meteorology, Climatology and Geophysics. Archived from the original on 1 January 2015. Retrieved 1 January 2015.
- 1 2 RSMC La Reunion Tropical Cyclone Center (13 December 2014). Tropical Cyclone Forecast Warning 13 December 2014 05:59 UTC (Report). Météo-France. Archived from the original on 1 January 2015. Retrieved 1 January 2015.
- ↑ Joint Typhoon Warning Center (13 December 2014). "Tropical Cyclone 03S (Bakung) Warning 13 December 2014 09:00z". United States Navy, United States Airforce. Archived from the original on 19 December 2014. Retrieved 1 January 2015.
- 1 2 3 Western Australian Regional Office (1 January 2015). Severe Tropical Cyclone Kate (Report). Australian Bureau of Meteorology. Archived from the original on 1 January 2015. Retrieved 1 January 2015.
- ↑ "Tropical Cyclone Outlook for the Western Region 22 December 2014". Australian Bureau of Meteorology. 22 December 2014. Archived from the original on 22 December 2014. Retrieved 1 January 2015.
- ↑ "Tropical Cyclone Outlook for the Western Region 2 January 2015". Australian Bureau of Meteorology. 2 January 2015. Archived from the original on 2 January 2015. Retrieved 2 January 2015.
- 1 2 3 "Tropical Cyclone Outlook for the Northern Region 2 January 2015". Australian Bureau of Meteorology. 2 January 2015. Archived from the original on 2 January 2015. Retrieved 2 January 2015.
- ↑ http://www.9news.com.au/national/2015/02/20/06/50/men-missing-in-boat-off-fraser-island
- ↑ Pamela Frost (23 March 2015). "Damage bill for Cyclone Marcia reaches $750 million". Noosa News. Retrieved 24 March 2015.
- 1 2 3 4 "Cyclone Olwyn: Live updates". Perth Now. 14 March 2014. Retrieved 21 March 2015.
- ↑ "Barrow Island 24 Hour Observations". Daily Observations. Weatherzone. 12 March 2015. Retrieved 22 March 2015.
- ↑ "Learmonth 24 Hour Observations". Daily Observations. Weatherzone. 13 March 2015. Retrieved 22 March 2015.
- 1 2 3 4 5 Daniel Smith and Geoff Boughton (March 16, 2015). "Cyclone Olwyn Rapid Damage Assessment Report". James Cook University. Retrieved March 22, 2015.
- 1 2 3 4 "Health fears as Carnarvon counts the cost of Tropical Cyclone Olwyn". Perth Now. 15 March 2014. Retrieved 22 March 2015.
- ↑ Kate Emery, Aiden Boyham and Natalie Brown (16 March 2015). "Carnarvon counts the cost". The West Australian. Archived from the original on 17 March 2015. Retrieved March 17, 2015.
- ↑ "Shark Bay Ap Daily Summaries". Daily Summaries. Weatherzone. 22 March 2015. Retrieved 22 March 2015.
- ↑ "Geraldton Ap 24 Hour Observations". Daily Observations. Weatherzone. 14 March 2015. Retrieved 22 March 2015.
- ↑ "Perth Daily Summaries". Daily Summaries. Weatherzone. 22 March 2015. Retrieved 22 March 2015. Due to the extensive damage, the name Olwyn was retired.
- ↑ Purtill, James. "Cyclone Nathan: Cyclone-ready Northern Territory town of Nhulunbuy hit harder than ever before". ABC News. Retrieved 23 March 2015.
- ↑ Bureau of Meteorology. "Tropical Cyclone Raquel Impacts". Retrieved March 19, 2016.
- ↑ Peter Hannam (July 1, 2015). "Cyclone Raquel forms as earliest big storm recorded off Australia's north-east". The Sydney Morning Herald. Retrieved July 2, 2015.
- ↑ Perth Tropical Cyclone Warning Centre (3 December 2014). "Tropical Cyclone Technical Bulletin: Australia: Western Region: 3 December 2014: 19:00 UTC". Australian Bureau of Meteorology. Archived from the original on 4 December 2014. Retrieved 1 January 2015.
- ↑ Perth Tropical Cyclone Warning Centre (3 December 2014). "High Seas Weather Warning for Metarea 10: 3 December 2014: 18:58 UTC". Australian Bureau of Meteorology. Archived from the original on 4 December 2014. Retrieved 1 January 2015.
- ↑ Perth Tropical Cyclone Warning Centre (4 December 2014). "Tropical Cyclone Technical Bulletin: Australia: Western Region: 4 December 2014: 07:10 UTC". Australian Bureau of Meteorology. Archived from the original on 4 December 2014. Retrieved 1 January 2015.
- 1 2 "Tropical Cyclone Outlook for the Western Region 13 December 2014". Australian Bureau of Meteorology. 13 December 2014. Archived from the original on 1 January 2015. Retrieved 1 January 2015.
- 1 2 "Tropical Cyclone Outlook for the Western Region 14 December 2014". Australian Bureau of Meteorology. 14 December 2014. Archived from the original on 1 January 2015. Retrieved 1 January 2015.
- ↑ "Tropical Cyclone Outlook for the Western Region 15 December 2014". Australian Bureau of Meteorology. 15 December 2014. Archived from the original on 1 January 2015. Retrieved 1 January 2015.
- ↑ "Tropical Cyclone Outlook for the Coral Sea 10 January 2015". Australian Bureau of Meteorology. 10 January 2015. Archived from the original on 10 January 2015. Retrieved 24 January 2015.
- ↑ Brisbane Tropical Cyclone Warning Centre. "Tropical Cyclone Technical Bulletin: Australia: Eastern Region: 11 January 2015 07:17z". Australian Bureau of Meteorology. Archived from the original on 12 January 2015. Retrieved 12 January 2015.
- ↑ "Tropical Cyclone Outlook for the Coral Sea 13 January 2015". Australian Bureau of Meteorology. 13 January 2015. Archived from the original on 13 January 2015. Retrieved 24 January 2015.
- 1 2 3 4 5 Western Australian Regional Office (January 2015). Tropical Low (PDF) (Report). Australian Bureau of Meteorology. Archived (PDF) from the original on 17 February 2015. Retrieved 17 February 2015.
- ↑ Western Australian Regional Office (27 February 2015). Severe Tropical Cyclone Lam (Report). Australian Bureau of Meteorology. Archived from the original on 27 February 2015. Retrieved 27 February 2015.
External links
| Wikimedia Commons has media related to 2014-15 Australian region cyclone season. |
- Australian Bureau of Meteorology
- Joint Typhoon Warning Center
- Tropical Cyclone Warning Center Jakarta (Indonesian)
- Digital Typhoon
Tropical cyclones of the 2014–15 Australian region cyclone season | ||
|---|---|---|
| ||
| ||