1997–98 South Pacific cyclone season
 | |
| Season summary map | |
| First system formed | October 8, 1997 |
|---|---|
| Last system dissipated | May 3, 1998 |
| Strongest storm1 | Ron and Susan – 900 hPa (mbar), 230 km/h (145 mph) (10-minute sustained) |
| Total depressions | 20 |
| Tropical cyclones | 16 (record high) |
| Severe tropical cyclones | 7 |
| Total fatalities | 50 total |
| Total damage | > $7.6 million (1998 USD) |
| 1Strongest storm is determined by lowest pressure | |
1995–96, 1996–97, 1997–98, 1998–99, 1999–00 | |
| Related articles | |
The 1997–98 South Pacific cyclone season was one of the most active and longest South Pacific tropical cyclone seasons on record, with 16 tropical cyclones occurring within the South Pacific basin between 160°E and 120°W. The season started earlier than normal with 3 systems developing before the official start of the season on November 1, 1997, while the final system of the season dissipated on May 3, 1998, after the season had officially ended on April 30. During the season 50 people died as a result of tropical cyclones, with the deadliest being Cyclone Martin with 27 known deaths. The strongest tropical cyclones during the season were Cyclone Ron and Cyclone Susan as both were estimated to have minimum pressures of 900 hPa (26.58 inHg), and were the most intense tropical cyclones on record in the South Pacific Ocean until Cyclone Zoe in 2002–03. After the season ended, 11 names had their names either removed or retired from the lists of names, after they caused significant impacts to South Pacific islands.
During the season, tropical cyclones were officially monitored by the Regional Specialized Meteorological Center (RSMC) in Nadi, Fiji and the Tropical Cyclone Warning Centers in Brisbane, Australia and Wellington, New Zealand. The United States Armed Forces through the Joint Typhoon Warning Center (JTWC) and Naval Pacific Meteorology and Oceanography Center (NPMOC), also monitored the basin and issued unofficial warnings for American interests. During the season RSMC Nadi issued warnings and assigned names to any tropical cyclones that developed between the Equator and 25°S while TCWC Wellington issued warnings for any that were located to the south of 25°S. The JTWC issued warnings for American interests on any significant tropical cyclone that was located between 160°E and the 180° while the NPMOC issued warnings for tropical cyclones forming between 180° and the American coast. RSMC Nadi and TCWC Wellington estimated sustained windspeeds over a 10-minute and used the Australian tropical cyclone intensity scale, while the JTWC and the NPMOC estimated sustained windspeeds over a 1-minute period which are compared to the Saffir-Simpson Hurricane Scale (SSHS).

Seasonal outlooks
| Record | Tropical Cyclone | Severe Tropical Cyclone | Ref |
|---|---|---|---|
| Average activity: (1969–70 – 1996–97) | 7 – 8 | 4 | [1] |
| Record high activity: | 1982-83: 14 | 1982–83:10 | [2] |
| Record low activity | 1994–95: 3 | 1994–95: 0 | [2] |
| Activity during this season: | 16 | 7 | [3] |
Ahead of the season officially starting on November 1, the American Samoan Governor reported that traditionalists were forecasting a hurricane to affect American Samoa, during the season after the big breadfruit and mango harvest that the island nation had experienced.[4] The Cook Islands Meteorological Service and National Disasters Committee warned islanders that they could expect the "worst cyclone season in years."[5] On November 27, New Zealand's National Institute of Water and Atmospheric Research, issued a press release, which predicted that because of the strong El Niño phenomenon, there would be more tropical cyclones than average.[6] In particular they predicted that due to the strong El Niño, countries within the western part of the basin were likely to see fewer tropical cyclones during the season than countries within the eastern part of the basin.[6]
The Southern Cook Islands, Tonga, Tuvalu and French Polynesia, were predicted to have an increased risk, while Fiji was forecast to have an average risk of being affected by a tropical cyclone.[6] NIWA also reported that Cyclone Martin's impact on the Northern Cook Islands was an early sign of what could be expected during the season, because the system had occurred further east than normal.[6] In mid December the Cook Islands Meteorological Service director commented to the media that from now on, by the time cyclones reached Raro-Tonga would have lost their intensity, while a spokesperson for NIWA commented that holidaymakers heading for the Pacific had a little chance of running into a cyclone as the damaging core of the cyclone was expected to be over the ocean while some cyclones were expected to be relatively weak.[7] It was also noted that collectively the Pacific Islands Meteorological Services were bracing for up to 15 tropical cyclones during the season, compared to 12 during an average season.[7]
Seasonal summary
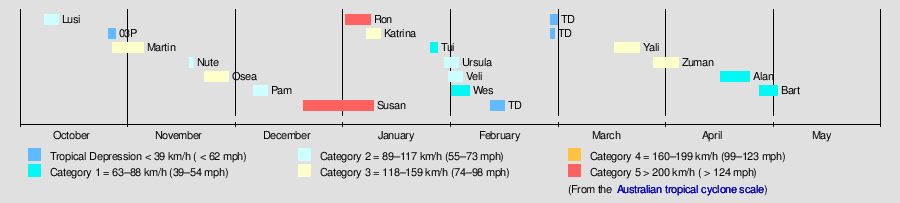
The 1997–98 season was one of the most active and longest South Pacific tropical cyclone seasons on record, with 16 tropical cyclones occurring within the South Pacific basin between 160°E and 120°W.[8] The season was characterised by a very strong El Niño Event, which caused the South Pacific Convergence Zone, to move from its usual position near the Solomon Islands to the Northern Cook Islands.[1] As a result, ten tropical cyclones formed to the east of the International Dateline, with seven of these tropical cyclones going on to affect French Polynesia.[1] After the 1996-97 season had one of the latest ends to a season on record, the 1997-98 season started early with three tropical systems observed before the start of the season on November 1, 1997.[8] Two other tropical systems, including the precursor tropical disturbance to Severe Tropical Cyclone Martin developed, before the official start of the season on November 1, 1997.[9] Severe Tropical Cyclone Martin impacted the Cook Islands and French Polynesia, where it caused significant damage and 28 deaths during the opening days of the season.[9] Tropical Cyclone Nute was named on November 18, before it moved out of the basin as a Category 2 tropical cyclone during November 19.[10] During the rest of November, several tropical disturbances developed along the South Pacific Convergence Zone, including the precursor system to Severe Tropical Cyclone Osea and Tropical Cyclone Pam.[10][11] Osea was named
Severe Tropical Cyclones Ron and Susan were both the strongest tropical cyclones of the season and were thought to be the strongest tropical cyclones in the region since Severe Tropical Cyclone Hina of the 1984-85 season.[1]
After the final warnings on Cyclone Tui were issued a weak circulation remained in the vicinity of Samoa for several days, before a westerly surge from the monsoon resulted in a tropical cyclone developing during February 1.[1] However, due to uncertainties in the continuation of Tui after several other weak low pressure areas had formed, RSMC Nadi decided to treat the cyclone as a separate system and named it Wes.[12]
Tropical Cyclone Bart developed during the final days of the season and caused ten deaths and minor damage to French Polynesia, before it dissipated during May 3. The names Katrina, Martin, Nute, Osea, Ron, Susan, Tui, Ursula and Veli, were subsequently retired from the lists of names for the region.[13]
Systems
Tropical Cyclone Lusi
| Category 2 tropical cyclone (Australian scale) | |||
|---|---|---|---|
| Tropical storm (SSHWS) | |||
| |||
| Duration | October 8 – October 12 | ||
| Peak intensity | 100 km/h (65 mph) (10-min) 980 hPa (mbar) | ||


On October 4, a cyclonic circulation became evident within an area of convection, that was located about 500 km (310 mi) to the southeast of Yaren in Nauru.[14][15] Over the next few days the system moved southwards, towards the upper subtropical ridge while outflow gradually developed further.[14][15] During October 8, the system was classified as a tropical depression as the system rapidly developed further, before the JTWC initiated initiated advisories on the depression and designated it as Tropical Cyclone 02P.[9][16][17] The FMS subsequently named the depression Lusi during the next day, as the system had intensified into the earliest tropical cyclone since 1970, while located about 1,020 km (635 mi) to the northwest of Port Villa, Vanuatu.[9][18][19] Over the next few days, Lusi moved towards the south-southeast, taking a so-called "gentleman's track" between Vanuatu and Fiji.[8]
During October 10, the JTWC reported that Lusi had peaked with 1-minute sustained wind speeds of 110 km/h (70 mph), while the system was located about 570 km (355 mi) to the northwest of Port Vila, Vanuatu.[15] The FMS subsequently followed suit during the next day and estimated peak 10-minute sustained wind speeds of 100 km/h (65 mph).[18] After it had peaked in intensity Lusi started to weaken in an area of cooler sea surface temperatures, while vertical windshear increased because of a mid level trough and strong north-westerlies.[8][14] During October 12, Lusi degenerated into an extratropical cyclone, before the remnants were last noted to the northeast of New Zealand[9][15][20] There was no impact caused by Lusi on any island, however, widespread heavy rainfall and gale force wind speeds were reported on several Fijian Islands.[17]
Severe Tropical Cyclone Martin
| Category 3 severe tropical cyclone (Australian scale) | |||
|---|---|---|---|
| Category 3 tropical cyclone (SSHWS) | |||
| |||
| Duration | October 27 – November 5 | ||
| Peak intensity | 155 km/h (100 mph) (10-min) 945 hPa (mbar) | ||


On October 27, the FMS started to monitor a weak tropical disturbance that had developed to the north of the Northern Cook Islands.[8] Over the next few days atmospheric convection surrounding the system remained disorganised, as the system moved to the southwest and was affected by strong upper-level north-easterly winds and moderate to strong vertical wind shear.[1][9] Late on October 30, the NPMOC designated the disturbance as Tropical Cyclone 04P, after it had developed into a tropical depression.[9][21][22] During the next day the system started to show a marked improvement in organisation and began rapidly developing, before RSMC Nadi named it Martin at 1500 UTC after it had developed into a category 1 tropical cyclone.[8] When it was named, Martin was located about 500 km (310 mi) to the west of Manihiki Atoll in the Northern Cook Islands and had started to re-curve and move towards the south-east during that day.[8][20][23] Early on November 1, RSMC Nadi reported that the system had become a category 2 tropical cyclone on the Australian scale, before the NPMOC reported that Martin had become equivalent to a category 1 hurricane on the SSHWS.[20][24]
During November 2, the system continued to intensify as it moved towards the southeast and became equivalent to a category 2 hurricane on the SSHWS, as it moved towards the French Polynesian Society Islands of Bellingshausen, Mopelia and Scilly.[1][20][24] During the next day, Martin passed near the Society Islands as it developed an 17 km (10 mi) eye, before RSMC Nadi reported at 06:00 UTC that the system had peaked as a category 3 severe tropical cyclone with 10-minute sustained wind speeds of 155 km/h (100 mph).[1][18][25] The NPMOC also reported at around that time that Martin had peaked with 1-minute sustained windspeeds of 185 km/h (115 mph), which made it equivalent to a category 3 hurricane on the SSHWS.[24][25] After peaking in intensity Martin started to weaken, as it interacted with a frontal system and started to accelerate towards the south-southeast.[8][26] During November 4, Martin passed within 250 km (160 mi) of Tahiti as it became a category 2 tropical cyclone and started to transition into an extratropical cyclone.[8][18][27] Later that day, the NPMOC issued their final advisory on system as it had become equivalent to a tropical depression, vertically sheared with its surface center dislocated about 110 km (70 mi) from its upper level center.[24][28] During November 5, Martin weakened below tropical cyclone intensity as it moved into TCWC Wellington's area of responsibility before the system was last noted on November 8.[8][20]
Tropical Cyclone Nute
| Category 2 tropical cyclone (Australian scale) | |||
|---|---|---|---|
| Category 1 tropical cyclone (SSHWS) | |||
| |||
| Duration | November 18 – November 19 | ||
| Peak intensity | 110 km/h (70 mph) (10-min) 975 hPa (mbar) | ||

On November 15, the United States Armed Forces started to monitor a tropical disturbance, that had developed within the South Pacific Convergence Zone about 1000 km (620 mi) to the northeast of Suva, Fiji.[29][30] Over the next few days the system moved towards the west, before it came under the influence of the subtropical ridge of high pressure.[29][30] At 0000 UTC on November 18, RSMC Nadi reported that the system had become a tropical depression, before the JTWC issued a tropical cyclone formation alert on the depression while it was located about 100 km (60 mi), to the southwest of the Solomon Island: Santa Cruz.[31][32] The JTWC initiated advisories on the depression at 0600 UTC and designated it as 05P, before six hours later, RSMC Nadi named the depression Nute, as it had intensified into a category one tropical cyclone.[8][32] Over the next day, Nute continued to intensify and developed an eye feature before at 0600 UTC on November 19, as the system approached 160°E, RSMC Nadi reported that Nute, had peaked as a category two tropical cyclone with 10-minute sustained wind speeds of 110 km/h (70 mph).[8][31] During that day RSMC Nadi reported that Nute was holding on to its peak intensity, while the JTWC reported at 1800 UTC that Nute had reached its 1-minute peak intensity of 140 km/h (85 mph) as it was entering the Australian region.[10][29] As Nute traversed an island-free area of the western South Pacific, there were no deaths or impact reported.[31]
Severe Tropical Cyclone Osea
| Category 3 severe tropical cyclone (Australian scale) | |||
|---|---|---|---|
| Category 2 tropical cyclone (SSHWS) | |||
| |||
| Duration | November 22 – November 28 | ||
| Peak intensity | 150 km/h (90 mph) (10-min) 950 hPa (mbar) | ||


On November 22, RSMC Nadi started to monitor a tropical depression that had developed about 465 km (290 mi) to the northeast of Manihiki Island.[10][33] Over the next two days, the depression gradually developed further.[10][34] At 1200 UTC on November 23, the NPMOC reported that the depression had become equivalent to a tropical storm and assigned it the designation 06P, before 12 hours later RSMC Nadi named the system Osea as it had developed into a category 1 tropical cyclone.[8][34] After developing into a tropical cyclone, Osea started moving towards the southeast.[10][35] During November 26, both agency's reported that the system had reached its peak intensity, with RSMC Nadi reporting 10-minute sustained windspeeds of 150 km/h (90 mph), while the NPMOC reported peak 1-minute sustained windspeeds of 165 km/h (105 mph).[20][33] After it had peaked, Osea started to gradually weaken, before during November 27 the NPMOC issued their final warning on the system as it had become sheared.[36] RSMC Nadi subsequently monitored Osea for another 24 hours before the system degenerated into a depression during November 28.[8][20]
While it was active, Osea caused no deaths but was quite destructive to some of the northwestern Society Islands, with over 700 homes destroyed or severely damaged on Maupiti, Bora-Bora, and Raiatea.[1] On Maupiti, an island with a population of 1,100, about 95% of the infrastructure was destroyed. The town hall, two schools, and an airfield were destroyed.[37] The town hall was evacuated due to the strong winds.[38] In addition, 77 homes on the island were destroyed.[39] Due to flooding, many highways were blocked.[40] On Bora-Bora, an island which had a population of 4,500 at the time, roughly 30% of the infrastructure was destroyed, including 309 houses.[10] On the north side of Bora Bora, nearly everything was destroyed, including the village of Vaitape.[41] In Vaitape, roads were blocked and telecommunication lines were hampered. Seven people on the island were injured.[42][43] Overall, 700 homes were at least somewhat destroyed by Osea.[44] Throughout French Polynesia, banana trees were knocked down due to the strong winds.[45]
Tropical Cyclone Pam
| Category 2 tropical cyclone (Australian scale) | |||
|---|---|---|---|
| Category 1 tropical cyclone (SSHWS) | |||
| |||
| Duration | December 6 – December 10 | ||
| Peak intensity | 110 km/h (70 mph) (10-min) 975 hPa (mbar) | ||
At the end of November, an equatorial westerly wind burst, occurred about 2,000 km (1,245 mi) to the south-west of Hawaii. This wind burst led to the development of two tropical cyclones, to the east of the International Dateline on either side of the equator.[1] During December 5, both RSMC Nadi and the NPMOC started to monitor the system as a tropical depression, while it was located between the Samoan and Northern Cook Islands.[1][46][47] During that day the system slowly developed and organized further and moved south-eastwards, before early on December 6, RSMC Nadi reported that the system had developed into a category 1 tropical cyclone and named it Pam.[8][46] After it was named the system continued to slowly drift towards the south-southeast, before it started to move quicker later that day as it passed near the Cook Island of Suwarrow.[46] As the system passed near Suwarrow, the NPMOC reported that Pam had reached its peak intensity with 1-minute sustained wind speeds of 120 km/h (75 mph), which made it equivalent to a category 1 hurricane on the SSHWS.[48]
Over the next couple of days the system moved southwards before RSMC Nadi reported during December 8, that Pam had peaked as a category 3 severe tropical cyclone with 10-minute sustained wind-speeds of 120 km/h (75 mph).[46][49] However, during the systems post analysis, RSMC Nadi reduced these winds slightly to 110 km/h (70 mph) which made Pam a category 2 tropical cyclone, rather than a category 3 severe tropical cyclone on the Australian scale.[20][49] During December 8, the system passed about 140 km (85 mi) to the east of Palmerston Island, before it passed about 75 km (45 mi) to the southwest of Rarotonga early the next day.[46] During December 9, Pam started to rapidly weaken as it transitioned into an extra-tropical cyclone, while RSMC Nadi reported during the next day that the system had degenerated into depression.[46][50] Over the next few days the system continued to move southeastwards, before it was last noted during December 14, while located to the west of Chile.[20]
Severe Tropical Cyclone Susan
| Category 5 severe tropical cyclone (Australian scale) | |||
|---|---|---|---|
| Category 5 tropical cyclone (SSHWS) | |||
| |||
| Duration | December 20 – January 9 | ||
| Peak intensity | 230 km/h (145 mph) (10-min) 900 hPa (mbar) | ||


On December 20, RSMC Nadi started to monitor a weak tropical disturbance, that was located about to the north of Tuvalu.[51][52] Over the next two weeks the system gradually moved towards the west-southwest, without developing into a tropical cyclone.[51] During January 3, the JTWC initiated warnings on the system and designated it as Tropical Cyclone 11P.[53] Later that day RSMC Nadi named the system Susan as the system had become a category 1 tropical cyclone, while it was located near the Fiji dependency of Rotuma.[54] During that day the system continued to rapidly develop with RSMC Nadi reporting early on January 4, that Susan had become a category 3 severe tropical cyclone, with 10-minute sustained windspeeds of 120 km/h (75 mph).[18] Later that day the JTWC reported that Susan had become equivalent to a category 1 hurricane on the Saffir-Simpson Hurricane Scale, as atmospheric convection surrounding the system organized further and developed an eye feature.[52][55]
Susan subsequently moved towards the southwest as the subtropical ridge of high pressure weakened.[56] Early on January 5, RSMC Nadi reported that Susan had peaked as a category 5 severe tropical cyclone with 10-minute sustained wind speeds of 140 mph (220 km/h), while the JTWC reported that Susan had peaked with 1-minute wind speeds of 260 km/h (160 mph) equivalent to a weak category five hurricane on the SSHS.[18][52][56] As the system reached its peak intensity, Susan was moving towards the southwest and as a result, it "posed a severe threat to Vanuatu," however during that afternoon, Susan recurved towards the southeast "just in time to spare Vanuatu, a direct hit.”[8] After turning away from Vanuatu, Susan accelerated towards the southeast while remaining near or at its peak intensities, before starting to weaken significantly during January 7.[18] RSMC Nadi then reported early the next day, that Susan had weakened into a category 4 severe tropical cyclone while it was located about 435 km (270 mi), to the southeast of Nadi, Fiji, which was close enough for the system to produce gale force winds in several southern and western Fijian Islands.[1][18] Later that day, Susan started to interact with Ron before by 0000 UTC on January 9, Susan had completely absorbed Ron.[8] The final advisories on the combined system, were then released later that day as the system lost its tropical characteristics and started to undergo an extratropical transition.[8][57] The remnants of the combined systems were then monitored for another day until they were last noted at 1200 UTC on January 10, bringing an unseasonable cold snap to New Zealand.[20][58]
Total damage from Susan was minor.[51] High seas in accordance with Susan inundated the village of Talaulia on Kadavu, Fiji. There was also some destroyed waterfront buildings, roads, jetties and bridges on Kadavu. In Beqa Island, only high seas and swells were experienced. In the town of Lautoka, on Viti Levu, roofs were blown off shops. This damage was possibly caused by a tornado that formed from one of the outer rain bands. One death was reported in accordance with Susan. This death was on Ambrym Island in Vanuatu, where a woman was killed by a falling coconut palm tree.[51]
Severe Tropical Cyclone Ron
| Category 5 severe tropical cyclone (Australian scale) | |||
|---|---|---|---|
| Category 5 tropical cyclone (SSHWS) | |||
| |||
| Duration | January 1 – January 8 | ||
| Peak intensity | 230 km/h (145 mph) (10-min) 900 hPa (mbar) | ||


The first tropical depression advisory was released on January 1 at 600 UTC to a depression that was to become Tropical Cyclone Ron. Ron drifted slowly for the next four days and reached tropical cyclone intensity on January 2 near Samoa. As a cyclone, Ron passed close to Swains Island on January 3 and intensified gradually after that. Peak 10-minute winds of 145 mph (225 km/h) were reached on January 5 north of Apia, American Samoa. Ron maintained that intensity for about 36 hours and began to move in a south-southeasterly course on January 6. Around 1800 UTC that day, Ron passed near Niuafo'ou, which reported sustained winds of 70 mph (110 km/h). The RSMC Nadi discussion at 1800 UTC noted that Ron may have had a smaller gale radius than had been thought. After passing Niuafo'ou, Ron passed to the south of Samoa and weakened. Ron started to move faster and weakened rapidly, merging with Tropical Cyclone Susan on January 9. Ron's lowest pressure was 900 millibars and 1-minute winds of 165 mph (265 km/h).[51]
Damage on Niuafo'ou was catastrophic. About 67 percent of the buildings on were either damaged or destroyed completely. Agricultural losses included 80–90 percent of the coconut and breadfruit trees were damaged. Crops such as taro, kape, manioc, and bananas were lost. The Tonga Chronicle reported that it would take at least five years to return crops to pre-cyclone stages. Damages and rehabilitation totaled out 1.1 million in Tongan dollars. However, no fatalities were reported on the island. Neighboring islands Niuatoputapu, Tafahi, and Vava'u sustained damage as well, but not as severe as Niuafo'ou. No reports of damage came from Swain's Island and Wallis Island. Ron's peak intensity of 900 millibars was the strongest of the season in the Southern Pacific and the strongest since Tropical Cyclone Hina in March 1985.[51]
Severe Tropical Cyclone Katrina
| Category 3 severe tropical cyclone (Australian scale) | |||
|---|---|---|---|
| Category 2 tropical cyclone (SSHWS) | |||
| |||
| Duration | January 7 – January 11 | ||
| Peak intensity | 150 km/h (90 mph) (10-min) 955 hPa (mbar) | ||


During January 7, Cyclone Katrina moved into the basin as a Category 2 tropical cyclone, while it was located about 90 km (55 mi) to the south of the Solomon Island: Rennel.[18][51] The system subsequently moved south-eastwards and intensified further, before it became a Category 3 Severe Tropical Cyclone and posed a threat to Vanuatu during the next day.
Tropical Cyclone Tui
| Category 1 tropical cyclone (Australian scale) | |||
|---|---|---|---|
| Tropical storm (SSHWS) | |||
| |||
| Duration | January 25 – January 27 | ||
| Peak intensity | 75 km/h (45 mph) (10-min) 990 hPa (mbar) | ||


On January 25, both RSMC Nadi and the NPMOC reported that Tropical Depression 16P, had developed about 360 km (225 mi) to the northwest of Apia, Samoa.[8][18][22] During that day, as the depression moved towards the southeast it gradually intensified further before at 2100 UTC, RSMC Nadi reported that the depression had intensified into a category one tropical cyclone, and named it as Tui, while it was located about 80 km (50 mi) to the northwest of Apia.[8] After it was named, Tui passed over the Samoan Islands of Upolu and Savai'i, before at 0600 UTC, both RSMC Nadi and the NPMOC reported that Tui had peaked with 10 and 1 minute sustained windspeeds of 75 km/h (45 mph).[18][59] After it had crossed Samoa, the system remained near stationary, just to the south of Samoa, before early on January 27 both the NPMOC and RSMC Nadi, reported that Tui had weakened into a depression and issued their final advisories.[8][51][59] After Tui was downgraded to a depression, a weak circulation remained in the vicinity of the Samoan islands for several days, before it possibly redeveloped into Tropical Cyclone Wes.[1][8] Ahead of Tui affecting the Samoan islands, Polynesian Airlines and Samoa Air cancelled all of their flights to the islands.[60] Large crop losses and some infrastructure damage were reported in American Samoa and Western Samoa after gale force wind gusts, heavy rain and rough seas brought down power lines, trees and other debris.[61][62] On the Western Samoan island of Savai'i, a young boy was killed when he stepped into an electrified puddle of water.[8]
Tropical Cyclone Ursula
| Category 2 tropical cyclone (Australian scale) | |||
|---|---|---|---|
| Category 1 tropical cyclone (SSHWS) | |||
| |||
| Duration | January 29 – February 2 | ||
| Peak intensity | 110 km/h (70 mph) (10-min) 975 hPa (mbar) | ||

Just after Tropical Cyclone Tui had weakened into a depression near the Samoan Islands, a new tropical depression developed to the northeast of Tahiti in French Polynesia during January 29.[1] Over the next day the system subsequently moved south-eastwards and gradually developed further, before it was declared to be a Category 1 tropical cyclone and named Ursula by the FMS.[51] Ursula subsequently gradually intensified and accelerated towards the south-east, as it got caught up in a westerly flow and passed through the Tuamotu archipelago.[18] During February 1, the system peaked as a Category 2 tropical cyclone with 10-minute wind speeds of 110 km/h (65 mph), before the NPMOC initiated advisories and designated Ursula as Tropical Cyclone 17P with peak 1-minute wind speeds of 120 km/h (75 mph).[18][51][63] Over the next day the system transitioned into an extratropical cyclone, before the remnants were last noted on February 5, while they were located around 4,350 km (2,705 mi) to the southwest of Lima, Peru.[1][20] In association with Tropical Cyclone Veli, Ursula brought significant waves which caused minor damages to three Tuamotuan islands of Mataiva, Rangiroa, Makatea.[64] Mataiva was the worst hit island with 39 homes damaged, while roads and bridges were washed away.[64] On Makatea island five houses were damaged while operations at Rangiroa's airstrip were disrupted, after coral and sand washed up onshore.[64]
Tropical Cyclone Veli
| Category 2 tropical cyclone (Australian scale) | |||
|---|---|---|---|
| Category 1 tropical cyclone (SSHWS) | |||
| |||
| Duration | January 30 – February 3 | ||
| Peak intensity | 100 km/h (65 mph) (10-min) 980 hPa (mbar) | ||
.jpg)

During January 30, a tropical depression developed about 650 km (405 mi) to the northeast of Apia in American Samoa.[18] Over the next couple of days the system moved eastwards while gradually developing further, with the NPMOC issuing a tropical cyclone formation alert on the system early on February 1.[18][65] Later that day the FMS named the system Veli as it had intensified into a category 1 tropical cyclone, while it came under the influence of a mid level trough of low pressure and started to move towards the southeast.[65] Later that day the NPMOC started to issue warnings on the system and designated it as Tropical Cyclone 18P, after it had continued to organize and convection surrounding the system had increased.[65] During that day Veli continued to move towards the southeast while gradually intensifying, before early the next day the NPMOC reported that the system had peaked with 1-minute sustained wind speeds of 140 km/h (85 mph).[66] Veli peaked as a category 2 tropical cyclone early on February 2, with 10-minute sustained wind speeds of 100 km/h (65 mph).[18] Over the next day, the cyclone moved through the Tuamotu group of islands, as it began to experience significant vertical windshear and weakened into a depression.[67] The system was subsequently monitored until it was last noted during February 4, about 1,500 km (930 mi) to the northwest of Adamstown on the Pitcairn Islands.[20] In association with Tropical Cyclone Ursula, Veli brought significant waves to French Polynesia's Tuamotu province and caused minor damages on the islands of Mataiva, Rangiroa, Makatea.[64] Mataiva was the worst hit island with roads and bridges washed away, and 39 homes damaged.[64] On Makatea island five houses were damaged while operations at Rangiroa's airstrip were disrupted after coral and sand washed up onshore.[64]
Tropical Cyclone Wes
| Category 2 tropical cyclone (Australian scale) | |||
|---|---|---|---|
| Tropical storm (SSHWS) | |||
| |||
| Duration | January 31 – February 5 | ||
| Peak intensity | 95 km/h (60 mph) (10-min) 985 hPa (mbar) | ||
.jpg)

On January 31, the FMS reported that a tropical depression had developed, about 230 km (145 mi) to the northwest of the American Samoan island of Apia.[12] During that day the depression moved slowly eastwards and intensified further, before it was named Wes by the FMS, after it had developed into a Category 1 tropical cyclone during February 1.[12] The NPMOC subsequently designated it as Tropical Cyclone 19P and initiated advisories later that day, with peak 1-minute sustained wind speeds of 85 km/h (50 mph).[12][68] The system subsequently continued to move eastwards and passed about 95 km (60 mi) to the south of the Cook Island: Nassau.[1][12] During February 3, the FMS reported that the system had peaked, with 10-minute sustained wind speeds of 90 km/h (55 mph) which made it a category 2 tropical cyclone on the Australian scale.[18] Later that day the system subsequently started to rapidly weaken as it moved into an area of higher vertical wind shear and interacted with the westerlies.[69][70] The system was subsequently last noted during February 5, while located about 400 km (250 mi) to the east of Papeete, on the island of Tahiti, French Polynesia.[12][18] The system did not directly affect any inhabited islands, while there was no damage reported on Suwarrow from the system.[1] However, 10 people were killed on the French Polynesian island of Tahaa, after two days of heavy rain associated with Wes caused a landslide during February 6.[71][72]
Severe Tropical Cyclone Yali
| Category 3 severe tropical cyclone (Australian scale) | |||
|---|---|---|---|
| Category 2 tropical cyclone (SSHWS) | |||
| |||
| Duration | March 18 – March 25 | ||
| Peak intensity | 130 km/h (80 mph) (10-min) 965 hPa (mbar) | ||
.jpg)

The system that was too become Yali was first noted as a tropical disturbance, to the northeast of Vanuatu during March 17.[73][74] During that day atmospheric convection over the disturbance's low level circulation center became better defined, before the JTWC initiated advisories and designated the system as Tropical Cyclone 29P, while the system was located about 650 km (405 mi) to the north-northwest of Port Vila.[8][75] Over the next day the system moved towards the west-southwest between Vanuatu and the Solomon Islands under the influence of the subtropical ridge of high pressure to the south of the system.[76] RSMC Nadi subsequently reported late on March 19, that the system had developed into a category 1 tropical cyclone and named it Yali.[8] After it was named Yali re-curved and started moving towards the south-southeast, as the monsoonal flow to the north of the system strengthened.[8][75]
For the next 2½ days, Yali moved to the southeast, passing west of the Vanuatu Islands. Yali came close enough to affect the isles of Tanna and Aneityum. Yali reached hurricane-force on the afternoon of March 21 and passed 60 nautical miles (110 km) west of Port Vila the next day.[75] Yali's peak intensity of 80 mph (130 km/h) and 965 millibars was reached on March 22 at 600 UTC.[75] At this time, Yali was just south of Port Vila, brushing it with 15 mph (24 km/h) winds and a minimal pressure of 992 millibars. There was a possibility that the low wind reading based on poor exposure of the instrument. By 1800 UTC March 22, Yali reached its most easternmost position at 220 nautical miles (410 km) southeast of Port Vila. The upper ridge to its north intensified, increasing wind shear and limiting convection. Due to this, Yali began to weaken and dropped below hurricane force.[75] At around the same time, a mid-level subtropical ridge began to influence its motion, sending it to the west. As Yali moved to the southwest, the wind field became asymmetric. At 1200 UTC March 23, Yali was just east of Noumea, New Caledonia with winds of 50 mph (80 km/h). The weakening Yali passed just south of New Caledonia on the night of March 23. By March 25, an upper-level low had caught the cyclone and influenced the circulation with cold air.[75]
RSMC Nadi downgraded Yali into an extratropical system and stopped issuing advisories.[75] The JTWC continued to track Yali in the general direction of Australia. The now semi-tropical Yali moved to the west and crossed 160°E on March 25. By the next day, Yali's center was 300 nautical miles (560 km) east-northeast of Brisbane, Australia. Some convection was re-developing just south of the center with gales possibly affecting the Australian coast on March 27. On the morning of March 27, the JTWC released its final bulletin on Yali, 325 nautical miles (602 km) east-southeast of Brisbane. The remnants of Yali went under a transformation in the Tasman Sea. The remnants came under a double jet structure and strong cyclone vorticity advection at 500 millibars.[75] The remnants of Yali deepened and moved towards the southern end of New Zealand.[75] The central pressure of the remnants reached 970–975 millibars as it crossed the coast of South Island on March 29. After passing New Zealand, Yali's remnants passed below the Antarctic Circle and was absorbed by a circumpolar trough between 65°S and 75°S.[75] Tanna received rather severe damage from Yali, however monetary estimates are not available.[75] About 60–70 percent of crops were destroyed and about 30% of the houses were damaged by the storm. Both Tanna and Aniwa were suffering a severe drought, so food stocks were low. Other places in Vanuatu only received minor damage. The passage of Yali in New Zealand caused high seas and flooding over South Island, Westport and Nelson. One fatality occurred when a youth died in New Plymouth. Trees toppled, roofs were ripped off and power lines fell.[75]
Severe Tropical Cyclone Zuman
| Category 3 severe tropical cyclone (Australian scale) | |||
|---|---|---|---|
| Category 3 tropical cyclone (SSHWS) | |||
| |||
| Duration | March 29 – April 5 | ||
| Peak intensity | 150 km/h (90 mph) (10-min) 955 hPa (mbar) | ||


During March 29, the FMS started to monitor a tropical depression that had developed under an upper level ridge of high pressure, about 520 km (325 mi) to the northeast of Port Vila, Vanuatu.[64][77] Over the next day the system quickly developed further as it slowly moved, towards Northern Vanuatu and was designated as Tropical Cyclone 31P early on March 30.[64][78]
Tropical Cyclone Alan
| Category 1 tropical cyclone (Australian scale) | |||
|---|---|---|---|
| Tropical storm (SSHWS) | |||
| |||
| Duration | April 17 – April 26 | ||
| Peak intensity | 75 km/h (45 mph) (10-min) 992 hPa (mbar) | ||
.jpg)

On April 17, the FMS started to monitor a tropical disturbance, that had developed to the east of the Northern Cook Islands.[8][79] Over the next few days the system moved erratically, before it developed into a Category 1 tropical cyclone and was named Alan by the FMS during April 21.[8] When it was named the system was located about 300 km (185 mi) to the east-southeast of Manihiki and had started to move westwards.[1] During April 22, the FMS estimated that Alan had reached its peak intensity with 10-minute sustained wind speeds of 75 km/h (45 mph), as the system started to pose several forecasting challenges as it was difficult to locate and estimate how intense the system was.[1][20] Later that day the NPMOC started to issue warnings on Alan and estimated peak 1-minute sustained wind speeds of 85 km/h (50 mph).[80][81] During April 23, the system appeared to become sheared with the low level circulation centre displaced about 20 km (10 mi) from the nearest atmospheric convection.[1][82] As a result, the FMS reported that Alan had weakened into a depression, while the NPMOC issued their final advisory on the system.[8][79][82] Over the next day as a mid level trough of low pressure that had been shearing the system moved faster than expected the depression became better organized.[35][79]
As a result, the NPMOC initiated advisories on the system again during April 24, while the FMS reported that Alan had re-intensified into a category 1 tropical cyclone later that day.[20][35] The system was now located about 555 km (345 mi) to the west-northwest of the French Polynesian island of Tahiti, and was now moving towards the south-southeast under the influence of an upper level anticyclone located to the east of Alan.[35][79] Early on April 25, Alan passed near too or over the French Polynesian Society Islands of Maupiti, Bora-Bora, and Raiatea.[79] During April 25, strong wind shear pulled the system apart, with visible imagery showing that the system had a fully exposed low level circulation.[8] As a result, the FMS reported that the system had weakened into a depression at 1800 UTC that day, while it was located about 185 km (115 mi) to the west-northwest of Tahiti.[8][79] The NPMOC subsequently reissued their final advisory early the next day, as the system drifted towards the south-southeast while located to the west of Tahiti.[79][83] The system affected French Polynesia with high winds and torrential rain, which caused several landslides within the Society Islands.[79][84] The landslides caused two bridges to collapse and along with fallen trees blocked roads.[85] Overall ten people died as a result of the system while thirty others were injured, with the majority of the casualties occurring due to landslides.[1][86] On the islands of Ra'iātea, Tahaa and Huahine several churches, schools and clinics were damaged while water and electricity supplies were cut off.[1][85] Within the islands around 750 houses were destroyed with 430 and 150 of these occurring on Huahine and Ra'iātea respectively.[85]
Tropical Cyclone Bart
| Category 1 tropical cyclone (Australian scale) | |||
|---|---|---|---|
| Tropical storm (SSHWS) | |||
| |||
| Duration | April 28 – May 3 | ||
| Peak intensity | 85 km/h (50 mph) (10-min) 987 hPa (mbar) | ||


During April 28, a tropical depression developed out of an area of low pressure, about 650 km (405 mi) to the northeast of Papeete, French Polynesia.[8][18] Over the next 24 hours the depression moved quickly to the southeast, while gradually intensifying with nearby automatic weather stations reporting strong winds and significant pressure drops.[8][87] The depression was subsequently named Bart by the FMS during April 29, after it had developed into a category 1 tropical cyclone on the Australian scale near the island of Hao.[79][88] The FMS reported during the next day that Bart had reached its peak 10-minute sustained windspeeds of 85 km/h (50 mph), as the system slowed down due to a blocking ridge of high pressure strengthening.[8][18]
The NPMOC subsequently initiated advisories on Bart and designated it as Tropical Cyclone 37P, while it was at its peak 1-minute sustained windspeeds of 65 km/h (40 mph).[87][88] However, by this time Bart had started to weaken, before on May 1, satellite imagery showed that the systems, low level centre had become exposed as the main area of convection had become sheared.[8] Despite gale force wind speeds occurring in Bart's southern semicircle, the system weakened into a tropical depression during May 1, before it dissipated to the north of Pitcairn Island on May 3.[8][79][89] Minor damage was recorded in French Polynesia, while 10 deaths were associated with Bart after waves from the system capsized a boat.[1][8][90]
Other systems
On October 24, the United States Armed Forces started to monitor an area of disturbed weather, that was located about 800 km (500 mi) to the north of Nadi, Fiji.[91] Over the next couple of days the system moved towards the southwest before early on October 26, as convection surrounding the system organized further, the FMS reported that the system had developed into a tropical depression, while the JTWC issued a tropical cyclone formation alert on it.[9][92] Later that day the JTWC initiated advisories on the depression designating it as Tropical Cyclone 03P, while it was at its peak 1-minute sustained windspeeds of 65 km/h (40 mph).[91][92] Over the next couple of days, a trough of low pressure approached the system and caused the depression to move south-eastwards, before the system dissipated to the north west of Fiji during October 28.[9] On February 11, a tropical depression developed about 185 km (115 mi) to the northwest of the Northern Cook Island: Suwarrow Atoll.[12] Over the next couple of days the depression moved westwards slowly before the centre was relocated late on February 13 to a position about 185 km (115 mi) to the south-southeast of Nassau Island.[12] Over the next few days the depression remained in the same general area before the final advisory was issued on February 15.[12] On February 28, the FMS reported that two tropical depressions had developed within the basin.[12] The first depression developed about 555 km (345 mi) to the northwest the French Polynesian island of Tahiti, before the final warning was issued during the next day after no development had occurred.[12] The second depression developed about 500 km (310 mi) to the southeast of Honiara on the Solomon island of Guadalcanal, over the next couple of days the depression drifted towards the southeast, before the final warning was issued on March 2.[75]
Season effects
This table lists all the storms that developed in the South Pacific basin during the 1997–98 season. It includes their intensity on the Australian Tropical cyclone intensity scale, duration, name, areas affected, deaths, and damages. For most storms the data is taken from RSMC Nadi's and or TCWC Wellington's archives, however data for 03P has been taken from the JTWC/NPMOC archives as opposed to RSMC Nadi's or TCWC Wellington's, and thus the winds are over 1-minute as opposed to 10-minutes.
| Name | Dates active | Peak classification | Sustained wind speeds |
Pressure | Land areas affected | Damage (USD) |
Deaths | Refs |
|---|---|---|---|---|---|---|---|---|
| Lusi | October 8 - 12 | Category 2 tropical cyclone | 95 km/h (60 mph) | 985 hPa (29.09 inHg) | Vanuatu, Fiji | None | None | [17] |
| 03P | October 26 – 28 | Tropical Depression | 55 km/h (35 mph) | 997 hPa (29.44 inHg) | None | None | None | [91] |
| Martin | October 27 – November 5 | Category 3 severe tropical cyclone | 155 km/h (100 mph) | 945 hPa (27.91 inHg) | Cook Islands, French Polynesia | $17.6 million | 28 | [8][93][94] |
| Nute | November 18 – 19 | Category 2 tropical cyclone | 110 km/h (70 mph) | 975 hPa (28.79 inHg) | None | None | None | [31] |
| Osea | November 22 – 28 | Category 3 severe tropical cyclone | 150 km/h (90 mph) | 950 hPa (28.05 inHg) | French Polynesia | None | ||
| Pam | December 6 – 10 | Category 2 tropical cyclone | 110 km/h (70 mph) | 975 hPa (28.79 inHg) | Cook Islands | Minor | None | [8] |
| Susan | December 20 – January 9 | Category 5 severe tropical cyclone | 230 km/h (145 mph) | 900 hPa (26.56 inHg) | Solomon Islands, Vanuatu, Fiji | $100 thousand | 1 | [54][95] |
| Ron | January 1 – 8 | Category 5 severe tropical cyclone | 230 km/h (145 mph) | 900 hPa (26.56 inHg) | Samoa, Wallis and Futuna, Tonga | None | ||
| Katrina | January 7 – 11 | Category 3 severe tropical cyclone | 150 km/h (90 mph) | 955 hPa (28.20 inHg) | Solomon Islands, Vanuatu | $8.66 million | 2 | [96] |
| Tui | January 25 – 27 | Category 1 tropical cyclone | 75 km/h (45 mph) | 990 hPa (29.25 inHg) | Samoan islands | $1 million | 1 | [96] |
| Ursula | January 29 – February 2 | Category 2 tropical cyclone | 110 km/h (70 mph) | 975 hPa (28.79 inHg) | French Polynesia | Minor | None | |
| Veli | January 30 – February 3 | Category 2 tropical cyclone | 100 km/h (65 mph) | 985 hPa (29.09 inHg) | French Polynesia | Minor | None | |
| Wes | January 31 – February 5 | Category 2 tropical cyclone | 95 km/h (60 mph) | 985 hPa (29.09 inHg) | Cook Islands, French Polynesia | None | 10 | |
| Unnamed | February 11 – 15 | Tropical Depression | 65 km/h (40 mph) | 995 hPa, (29.39 inHg) | None | None | None | [97] |
| Unnamed | February 28 – March 2 | Tropical Depression | 45 km/h (30 mph) | 997 hPa, (29.44 inHg) | None | None | None | [97] |
| Unnamed | February 28 – March 1 | Tropical Depression | 45 km/h (30 mph) | 998 hPa, (29.47 inHg) | None | None | None | [97] |
| Yali | March 18 – 25 | Category 3 severe tropical cyclone | 130 km/h (80 mph) | 965 hPa (28.50 inHg) | Melanesia, Australia, New Zealand | $6 million | 1 | [98] |
| Zuman | March 29 – April 5 | Category 3 severe tropical cyclone | 150 km/h (90 mph) | 955 hPa (28.20 inHg) | Vanuatu, New Caledonia | $6 million | None | [98] |
| Alan | April 17 – 26 | Category 1 tropical cyclone | 75 km/h (45 mph) | 992 hPa (29.31 inHg) | French Polynesia | 10 | [86] | |
| Bart | April 28 – May 5 | Category 1 tropical cyclone | 85 km/h (50 mph) | 987 hPa (29.15 inHg) | French Polynesia | Minor | 10 | [8][90] |
| Season Aggregates | ||||||||
| 20 systems | October 8 – May 5 | 230 km/h (145 mph) | 900 hPa (26.56 inHg) | 53 | ||||
See also
| Wikimedia Commons has media related to 1997-98 South Pacific cyclone season. |
- Atlantic hurricane seasons: 1997, 1998
- Pacific hurricane seasons: 1997, 1998
- Pacific typhoon seasons: 1997, 1998
- North Indian Ocean cyclone seasons: 1997, 1998
- 1997–98 South-West Indian Ocean cyclone season
- 1997–98 Australian region cyclone season
- 1982–83 South Pacific cyclone season
References
- 1 2 3 4 5 6 7 8 9 10 11 12 13 14 15 16 17 18 19 20 21 22 23 Chappel Lori-Carmen; Bate Peter W (June 2, 2000). "The South Pacific and Southeast Indian Ocean Tropical Cyclone Season 1997–98" (PDF). Australian Meteorological Magazine. Australian Bureau of Meteorology. 49: 135–136. Archived (PDF) from the original on June 30, 2014. Retrieved July 1, 2014.
- 1 2 Climate Services Division (October 26, 2010). Tropical Cyclone Guidance for Season 2010/11 for the Fiji and the Southwest Pacific (PDF) (Report). Fiji Meteorological Service. Archived (PDF) from the original on February 27, 2012. Retrieved April 6, 2012.
- ↑ RSMC Nadi — Tropical Cyclone Centre (October 22, 2015). "2015–16 Tropical Cyclone Season Outlook in the Regional Specialised Meteorological Centre Nadi – Tropical Cyclone Centre (RSMC Nadi – TCC) Area of Responsibility (AOR)" (PDF). Fiji Meteorological Service. Archived (PDF) from the original on October 22, 2015. Retrieved October 22, 2015.
- ↑ Samoa News — Pacific Islands report. (October 1, 1997). "Governor Tauese predicts Hurricane to hit American Samoa this year". Pacific Islands Development Program/Center for Pacific Islands Studies. Archived from the original on March 10, 2012. Retrieved February 22, 2012.
- ↑ Pacific Islands Report (October 9, 1997). "Cook Islands face possibility of worst cyclone season in years". Pacific Islands Development Program/Center for Pacific Islands Studies. Archived from the original on March 10, 2012. Retrieved July 26, 2011.
- 1 2 3 4 National Institute of Water and Atmospheric Research (November 27, 1997). "El Niño predicted to cause more frequent tropical cyclones in South Pacific". National Oceanic and Atmospheric Administration. Archived from the original on March 10, 2012. Retrieved June 19, 2011.
- 1 2 "No big cyclones expected". The Evening Post. Wellington, New Zealand. December 17, 1997. p. 18. – via Lexis Nexis (subscription required)
- 1 2 3 4 5 6 7 8 9 10 11 12 13 14 15 16 17 18 19 20 21 22 23 24 25 26 27 28 29 30 31 32 33 34 35 36 37 38 39 40 RSMC Nadi — Tropical Cyclone Centre (August 29, 2007). RSMC Nadi Tropical Cyclone Seasonal Summary 1997-98 (PDF) (Report). Fiji Meteorological Service. Archived (PDF) from the original on August 1, 2010. Retrieved May 29, 2011.
- 1 2 3 4 5 6 7 8 9 Padgett, Gary (1997). "Monthly Global Tropical Cyclone Summary October 1997". Archived from the original on June 5, 2011. Retrieved July 23, 2013.
- 1 2 3 4 5 6 7 Padgett, Gary. Monthly Global Tropical Cyclone Summary November 1997 (Report). Archived from the original on November 25, 2012. Retrieved November 11, 2012.
- ↑ http://dailypost.vu/news/developing-el-nino-predicted-stronger-than---dubbed-godzilla/article_fe5cafeb-3ac9-5da5-b17d-9c3f29359515.html
- 1 2 3 4 5 6 7 8 9 10 11 Padgett, Gary. "Monthly Global Tropical Cyclone Summary February 1998". Archived from the original on February 22, 2014. Retrieved February 22, 2014.
- ↑ RA V Tropical Cyclone Committee (May 5, 2015). Tropical Cyclone Operational Plan for the South-East Indian Ocean and the Southern Pacific Ocean 2014 (PDF) (Report). World Meteorological Organization. pp. 2B–1–2B–4 (23–26). Archived (PDF) from the original on May 24, 2015. Retrieved May 6, 2015.
- 1 2 3 Darwin Regional Specialised Meteorological Centre. "October 1997" (PDF). Darwin Tropical Diagnostic Statement. Australian: Bureau of Meteorology. 16 (10): 2–3. ISSN 1321-4233. Retrieved January 11, 2012.
- 1 2 3 4 Naval Pacific Meteorology and Oceanography Center, Joint Typhoon Warning Center (2002). "Tropical Cyclone 02P (Lusi) best track analysis". United States Navy, United States Air Force. Retrieved May 30, 2011.
- ↑ Joint Typhoon Warning Center (October 8, 1997). "Tropical Cyclone 02P (Lusi) warning October 8, 1997 20z". United States Navy, United States Air Force. Retrieved June 29, 2011.
- 1 2 3 RSMC Nadi — Tropical Cyclone Centre (1997). Report on Tropical Cyclone Lusi October 6-12, 1997 (PDF) (Report). Fiji Meteorological Service. Archived (PDF) from the original on February 27, 2014. Retrieved February 27, 2014.
- 1 2 3 4 5 6 7 8 9 10 11 12 13 14 15 16 17 18 19 20 RSMC Nadi — Tropical Cyclone Centre; TCWC Brisbane; TCWC Wellington (May 22, 2009). "RSMC Nadi — Tropical Cyclone Centre Best Track Data for 1997/98 Cyclone Season". Fiji Meteorological Service, Meteorological Service of New Zealand Limited, Australian Bureau of Meteorology. United States: International Best Track Archive for Climate Stewardship. Retrieved January 31, 2013.
- ↑ Terry, James P (2007). Tropical cyclones: climatology and impacts in the South Pacific. Springer. ISBN 978-0-387-71542-1. Retrieved September 21, 2015.
- 1 2 3 4 5 6 7 8 9 10 11 12 13 14 MetService (May 22, 2009). "TCWC Wellington Best Track Data 1967–2006". International Best Track Archive for Climate Stewardship.
- ↑ Naval Pacific Meteorology and Oceanography Center (October 30, 1997). Tropical Cyclone 04P Warning 1 October 30, 1997 21z (Report). United States Navy, United States Air Force. Archived from the original on January 15, 2012. Retrieved August 9, 2012.
- 1 2 Joint Typhoon Warning Center; Naval Pacific Meteorology and Oceanography Center (1998). Chapter 4 Summary of South Pacific and South Indian Tropical Cyclones (PDF) (1998 Annual Tropical Cyclone Report). United States Navy, United States Airforce. p. 128. Archived (PDF) from the original on July 24, 2013. Retrieved July 23, 2013.
- ↑ Naval Pacific Meteorology and Oceanography Center (November 1, 1997). Tropical Cyclone 04P (Martin) Warning 4 November 1, 1997 09z (Report). United States Navy, United States Air Force. Archived from the original on August 1, 2013. Retrieved August 1, 2013.
- 1 2 3 4 Naval Pacific Meteorology and Oceanography Center; Joint Typhoon Warning Center. Tropical Cyclone 04P (Martin) best track analysis (Report). United States Navy, United States Air Force. Retrieved July 23, 2013.
- 1 2 Naval Pacific Meteorology and Oceanography Center (November 3, 1997). Tropical Cyclone 04P (Martin) Warning 8 November 3, 1997 09z (Report). United States Navy, United States Air Force. Archived from the original on August 1, 2013. Retrieved August 1, 2013.
- ↑ Naval Pacific Meteorology and Oceanography Center (November 3, 1997). Tropical Cyclone 04P (Martin) Warning 9 November 3, 1997 21z (Report). United States Navy, United States Air Force. Archived from the original on August 1, 2013. Retrieved August 1, 2013.
- ↑ Naval Pacific Meteorology and Oceanography Center (November 4, 1997). Tropical Cyclone 04P (Martin) Warning 10 November 4, 1997 03z (Report). United States Navy, United States Air Force. Archived from the original on August 1, 2013. Retrieved August 1, 2013.
- ↑ Naval Pacific Meteorology and Oceanography Center (November 4, 1997). Tropical Cyclone 04P (Martin) Warning 11 November 4, 1997 21z (Report). United States Navy, United States Air Force. Archived from the original on August 1, 2013. Retrieved August 1, 2013.
- 1 2 3 Naval Pacific Meteorology and Oceanography Center, Joint Typhoon Warning Center (2002). "Tropical Cyclone 05P (Nute) best track analysis". United States Navy, United States Air Force. Retrieved May 30, 2011.
- 1 2 Darwin Regional Specialised Meteorological Centre (1997). "November 1997" (PDF). Darwin Tropical Diagnostic Statement. Australian Bureau of Meteorology. 16 (11): 2. ISSN 1321-4233. Retrieved March 1, 2012.
- 1 2 3 4 Brisbane Tropical Cyclone Warning Center (2010). "Tropical Cyclone Nute". Australian Bureau of Meteorology. Retrieved May 30, 2011.
- 1 2 Joint Typhoon Warning Center (1997). "Tropical Cyclone 05P (Nute) Advisories". Australian Severe Weather. Archived from the original on July 6, 2012. Retrieved May 30, 2011.
- 1 2 Naval Pacific Meteorology and Oceanography Center, Joint Typhoon Warning Center. "Tropical Cyclone 06P (Osea) best track analysis". United States Navy, United States Air Force. Retrieved November 14, 2012.
- 1 2 Naval Pacific Meteorology and Oceanography Center. "Tropical Cyclone 06P (Osea) Warning 1 November 24, 1997 15z". United States Navy, United States Air Force. Archived from the original on November 25, 2012. Retrieved November 25, 2012.
- 1 2 3 4 Naval Pacific Meteorology and Oceanography Center. "Tropical Cyclone 06P (Osea) Warning 4 November 25, 1997 03z". United States Navy, United States Air Force. Archived from the original on November 25, 2012. Retrieved November 25, 2012.
- ↑ Naval Pacific Meteorology and Oceanography Center. "Tropical Cyclone 06P (Osea) Warning 8, November 27, 1997, 00z". United States Navy, United States Air Force. Archived from the original on November 24, 2012. Retrieved November 24, 2012.
- ↑ Padgett, Gary. Monthly Global Tropical Cyclone Summary November 1997 (Report). Retrieved November 11, 2012.
- ↑ "Powerful El Nino Causing Havoc in Pacific". Papeete, Tahiti: International Indigenous ICT Task Force. February 24, 2010. Retrieved November 25, 2012.
- ↑ The Ensign of the Church of Jesus Christ of Latter-Day Saints, Volume 28. The Church. 1998.
- ↑ "Tropical Storms". Times-Union. December 7, 1997. Retrieved November 11, 2012.
- ↑ "Powerful cyclones pound South Pacific islands". Oceanavaigator.com. Retrieved November 11, 2012.
- ↑ Pacific Islands Report (November 26, 1997). "Cyclone Osea sweeps through French Polynesia". Pacific Islands Development Program/Center for Pacific Islands Studies. Archived from the original on November 25, 2012. Retrieved November 25, 2012.
- ↑ "7 blesses apres le passage d'Osea". Les Échos. Le Monde. November 28, 1997. (accessed via Lexis Nexis on November 25, 2012)
- ↑ "Pacific Islanders confident of surviving Cyclone Pam". Agence France Presse. December 8, 1997.
- ↑ Cauchois, Mickaelle-Hinanui; Service du Patrimoine, Ministere de la Culture (2002). "Dryland Horticulture in Maupiti: An Ethnoarchaeological Study" (PDF). University of Hawai'i Press. p. 277. Retrieved November 25, 2012.
- 1 2 3 4 5 6 Padgett, Gary. "Monthly Global Tropical Cyclone Summary December 1997". Archived from the original on February 22, 2014. Retrieved February 22, 2014.
- ↑ Joint Typhoon Warning Center. "Tropical Cyclone 07P Warning 1 December 6, 1997 21z". United States Navy, United States Air Force. Archived from the original on February 15, 2014. Retrieved February 23, 2014.
- ↑ Joint Typhoon Warning Center. "Tropical Cyclone 07P (Pam) best track analysis". United States Navy, United States Air Force. Retrieved February 23, 2014.
- 1 2 Padgett, Gary. "Monthly Global Tropical Cyclone Tracks December 1997". Archived from the original on February 23, 2014.
- ↑ Joint Typhoon Warning Center. "Tropical Cyclone 07P (Pam) Warning 9 December 9, 1997 21z". United States Navy, United States Air Force. Archived from the original on February 15, 2014. Retrieved February 23, 2014.
- 1 2 3 4 5 6 7 8 9 10 Padgett, Gary. Monthly Global Tropical Cyclone Summary January 1998 (Report). Retrieved January 21, 2015.
- 1 2 3 Joint Typhoon Warning Center; Naval Pacific Meteorology and Oceanography Center. "Tropical Cyclone 11P (Susan) best track analysis". United States Navy, United States Air Force. Archived from the original on January 1, 2012. Retrieved February 28, 2014.
- ↑ Joint Typhoon Warning Center (January 3, 1998). "Tropical Cyclone 11P (Susan) Warning 1 January 3, 1998 0000z". United States Navy, United States Air Force. Archived from the original on January 1, 2012. Retrieved July 18, 2011.
- 1 2 RSMC Nadi — Tropical Cyclone Centre (January 20, 1998). Preliminary Report on Tropical Cyclone Susan — January 3 - 9, 1998 (PDF) (Report). Fiji Meteorological Service. Archived (PDF) from the original on December 14, 2013. Retrieved December 14, 2013.
- ↑ Joint Typhoon Warning Center (January 4, 1998). "Tropical Cyclone 11P (Susan) Warning 4, January 4, 1998 1200z". United States Navy, United States Air Force. Retrieved July 18, 2011.
- 1 2 Darwin Regional Specialised Meteorological Centre (1998). "January 1998" (PDF). Darwin Tropical Diagnostic Statement. Australian: Bureau of Meteorology. 17 (1): 2–3. ISSN 1321-4233. Retrieved January 11, 2012.
- ↑ Naval Pacific Meteorological and Oceanographic Center (January 9, 1998). "Tropical Cyclone 11P (Susan) Warning 13 January 9, 1998 0300z". United States Navy, United States Air Force. Archived from the original on January 1, 2012. Retrieved July 18, 2011.
- ↑ "Blame Cyclone Susan for cold snap". The Southland Times. New Zealand: The Southland Times Co. Ltd. January 10, 1998. p. 1.
- 1 2 Naval Pacific Meteorology and Oceanography Center, Joint Typhoon Warning Center (December 17, 2002). "Tropical Cyclone 16P best track analysis". United States Navy, United States Air Force. Retrieved June 2, 2011.
- ↑ "Cyclone Tui heading toward Samoa". Agence France Presse. January 25, 1998.
- ↑ Pacific Islands Report (January 27, 1998). "Samoans examining damage from Cyclone Tui". Pacific Islands Development Program/Center for Pacific Islands Studies. Archived from the original on July 26, 2011. Retrieved July 26, 2011.
- ↑ National Climatic Data Center. Del Greco, Stephen; Hinson, Stuart, eds. "January 1998" (PDF). Storm Data. National Environmental Satellite Data, And Information Service, National Oceanic And Atmospheric Administration. 39 (1): 15. Archived (PDF) from the original on August 9, 2012. Retrieved August 9, 2012.
- ↑ Naval Pacific Meteorology and Oceanography Center, Joint Typhoon Warning Center (December 17, 2002). "Tropical Cyclone 17P best track analysis". United States Navy, United States Air Force. Retrieved June 5, 2011.
- 1 2 3 4 5 6 7 8 Padgett, Gary (1998). "Monthly Global Tropical Cyclone Summary March 1998". Australian Severe Weather. Archived from the original on November 28, 2015. Retrieved November 28, 2015.
- 1 2 3 "Tropical Cyclone 18P (Veli) warning February 1, 1998 09z". Naval Pacific Meteorology and Oceanography Center. February 1, 1998. Archived from the original on July 30, 2012. Retrieved August 5, 2012.
- ↑ "Tropical Cyclone 18P (Katrina) best track analysis". Naval Pacific Meteorology and Oceanography Center. Archived from the original on August 4, 2012. Retrieved August 4, 2012.
- ↑ Naval Pacific Meteorology and Oceanography Center (February 1, 1998). "Tropical Cyclone 18P (Veli) warning February 3, 1998 21z". United States Navy, United States Air Force. Archived from the original on August 5, 2012. Retrieved August 5, 2012.
- ↑ Naval Pacific Meteorology and Oceanography Center (February 1, 1998). Tropical Cyclone 19P (Wes) Warning 1 February 1, 1998 15z (Report). United States Navy, United States Air Force. Archived from the original on December 28, 2013. Retrieved June 28, 2014.
- ↑ Naval Pacific Meteorology and Oceanography Center (February 3, 1998). Tropical Cyclone 19P (Wes) Warning 5 February 3, 1998 15z (Report). United States Navy, United States Air Force. Archived from the original on June 29, 2014. Retrieved June 29, 2014.
- ↑ Naval Pacific Meteorology and Oceanography Center (February 4, 1998). Tropical Cyclone 19P (Wes) Warning 6 February 4, 1998 03z (Report). United States Navy, United States Air Force. Archived from the original on June 29, 2014. Retrieved June 29, 2014.
- ↑ "Six still missing after landslide kills ten on island". Australian Associated Press. February 8, 1998. – via Lexis Nexis (subscription required)
- ↑ "Landslide on Tahaa, French Polynesia kills at least 10". Radio Australia. February 8, 1998. Archived from the original on June 28, 2014.
- ↑ Joint Typhoon Warning Center. "Tropical Cyclone 29P (Yali) best track analysis". United States Navy, United States Air Force. Retrieved February 15, 2014.
- ↑ Joint Typhoon Warning Center. "Tropical Cyclone Formation Alert March 17, 1998 23z". United States Navy, United States Air Force. Archived from the original on February 15, 2014. Retrieved February 15, 2014.
- 1 2 3 4 5 6 7 8 9 10 11 12 13 Padgett, Gary (1998). "Monthly Global Tropical Cyclone Summary March 1998". Archived from the original on June 5, 2011. Retrieved June 27, 2011.
- ↑ Joint Typhoon Warning Center. "Tropical Cyclone 29P Warning 3 March 19, 1998 21z". United States Navy, United States Air Force. Archived from the original on February 15, 2014. Retrieved February 15, 2014.
- ↑ Darwin Regional Specialised Meteorological Centre. "April 1998" (PDF). Darwin Tropical Diagnostic Statement. Australian Bureau of Meteorology. 17 (4): 2. ISSN 1321-4233. Retrieved February 25, 2014.
- ↑ "Tropical Cyclone 29P (Zuman) warning March 30, 1998 03z". Joint Typhoon Warning Center. March 30, 1998. Retrieved November 21, 2015.
- 1 2 3 4 5 6 7 8 9 10 Padgett, Gary (1998). "Monthly Global Tropical Cyclone Summary April 1998". Archived from the original on January 15, 2012. Retrieved May 29, 2011.
- ↑ Padgett, Gary. "Monthly Global Tropical Cyclone Tracks April 1998". Archived from the original on February 8, 2014. Retrieved February 8, 2014.
- ↑ Naval Pacific Meteorology and Oceanography Center. "Tropical Cyclone 32P (Alan) Warning 1 April 22, 1998 21z". United States Navy, United States Air Force. Archived from the original on February 8, 2014. Retrieved February 8, 2014.
- 1 2 Naval Pacific Meteorology and Oceanography Center. "Tropical Cyclone 32P (Alan) Warning 3 April 23, 1998 21z". United States Navy, United States Air Force. Archived from the original on February 9, 2014. Retrieved February 9, 2014.
- ↑ Naval Pacific Meteorology and Oceanography Center (April 26, 1998). "Tropical Cyclone 32P (Alan) Warning 7 April 26, 1998 03z". United States Navy, United States Air Force. Archived from the original on February 9, 2014. Retrieved February 9, 2014.
- ↑ "At least eight killed by French Polynesia cyclone". Pacific Islands Report. Pacific Islands Development Program/Center for Pacific Islands Studies. April 27, 1998. Archived from the original on February 9, 2014. Retrieved February 9, 2014.
- 1 2 3 Padgett, Gary (1998). "Monthly Global Tropical Cyclone Summary May 1998". Archived from the original on February 8, 2014. Retrieved May 29, 2011.
- 1 2 "French Polynesia cyclone deaths rise to 10". Pacific Islands Report. Pacific Islands Development Program/Center for Pacific Islands Studies. May 1, 1998. Archived from the original on February 9, 2014. Retrieved February 9, 2014.
- 1 2 Naval Pacific Meteorology and Oceanography Center, Joint Typhoon Warning Center (December 17, 2002). "Tropical Cyclone 37P (Bart) best track analysis". United States Navy, United States Air Force. Retrieved May 29, 2011.
- 1 2 Naval Pacific Meteorology and Oceanography Center (April 30, 1998). "Tropical Cyclone 37P (Bart) warning April 30, 1998 18z". United States Navy, United States Air Force. Archived from the original on June 5, 2011. Retrieved June 5, 2011.
- ↑ Naval Pacific Meteorology and Oceanography Center (April 30, 1998). "Tropical Cyclone 37P (Bart) warning May 2, 1998 06z". United States Navy, United States Air Force. Archived from the original on June 5, 2011. Retrieved June 5, 2011.
- 1 2 May, Jutta (September 17, 2008). "Event Information: Tropical Cyclone Bart". Pacific Disaster.Net. Archived from the original on January 15, 2012. Retrieved June 2, 2011.
- 1 2 3 Naval Pacific Meteorology and Oceanography Center, Joint Typhoon Warning Center (December 17, 2002). "Tropical Cyclone 03P best track analysis". United States Navy, United States Air Force. Retrieved June 5, 2011.
- 1 2 Joint Typhoon Warning Center (October 26, 1997). "Tropical Cyclone 03P Warning 1 October 26, 1997 1500 UTC". United States Navy, United States Air Force. Archived from the original on January 15, 2012. Retrieved June 30, 2011.
- ↑ Asian Development Bank (November 29, 2000). Project completion report on the cyclone emergency rehabilitation project (Loan 1588-COOSF) in the Cook Islands (PDF) (Report). p. 8. Retrieved January 17, 2012.
- ↑ Cook Islands Government (June 20, 2007). "Coroner confirms Cyclone Martin Victims". Archived from the original on August 1, 2010. Retrieved April 30, 2010.
- ↑ "Tropical Cyclones/Depressions that passed through Solomon Islands Region" (PDF). Solomon Islands Meteorological Service. September 13, 2009. Archived (PDF) from the original on March 9, 2013. Retrieved November 25, 2015.
- 1 2 McKenzie, Emily; Prasad, Biman; Kaloumaira, Atu (2005). Economic Impact of Natural Disasters on development in the Pacific Volume 1: Research Report (PDF) (Report). pp. 10–89. Archived from the original (PDF) on February 25, 2010. Retrieved June 29, 2010.
- 1 2 3 Padgett, Gary. "Monthly Global Tropical Cyclone Tracks February 1998". Archived from the original on July 24, 2012.
- 1 2 Report of the WMO Post-Tropical Cyclone "Pam" Expert Mission to Vanuatu (PDF) (Report). World Meteorological Organization. p. 22.
External links
- World Meteorological Organization
- Australian Bureau of Meteorology
- Fiji Meteorological Service
- Meteorological Service of New Zealand
- Joint Typhoon Warning Center
Tropical cyclones of the 1997–98 South Pacific cyclone season | ||
|---|---|---|
| ||